CalCOFI 1902RL
| CTD Processing Summary CalCOFI 1902RL CTD FINAL Data | |||
| Download 1902RL CTD raw cast files zipped | Download 1902RL FINAL CTD + bottle data | ||
|
General CTD Notes - data acquisition notes, logistics, processing - see below. |
|||
| CTD sensor corrections derived by comparing CTD sensor data, 4sec averages prior-to-bottle closure, to bottle samples | |||
| Dual T, S, & O2 | Primary Sensor | Secondary Sensor | |
| Salinity offset (bottle - CTD salinity; > 350m only; Seabird SBE4) | 0.0010 | -0.0044 | |
| Oxygen ml/L (dual Seabird SBE43) |
y = 1.0484x + 0.0164 R² = 0.9998 |
y = 1.0779x + 0.0441 R² = 0.9997 |
|
| Oxygen umol/Kg (dual Seabird SBE43) |
y =1.0486x + 0.7276 R² = 0.9998 |
y = 1.0781x + 1.9354 R² = 0.9996 |
|
| Single sensors | Linear | Polynomial | |
|
Nitrate - ISUS 4sec ave voltage vs Bottle NO3 (Satlantic ISUS v3 SNMBARI-ISUS; NEW LAMP) |
y = 27.543x - 24.379 R² = 0.956 |
Note: ISUS lamp was replaced, burn-in drift will be dealt with by regressing individual casts vs bottle NO3 samples - see individual plots. | |
| Fluorometer - linear & polynomial regressions |
y= 11.664x - 0.4473 R² = 0.8618 |
y = 14.443x2+ 7.3964x - 0.2501 R² = 0.8826 **used for calculations |
|
 |
 |
||
 |
 |
||
 |
 |
||
| Project: | CalCOFI 1902RL (UNOLS RL1901) |
| Summary: |
CalCOFI's original January winter cruise was postponed by the government shutdown. With the ship's impeding dry dock schedule and another possible government shutdown Feb 15th, our winter cruise was compressed into 8 days at sea. Core stations on Line 90 & 80 out to 100 were the focus. Additional stations on Lines 83 (83.3) & 87 (86.7) out to station 60 were planned, time-permitting. We were able to occupy 29 of 31 stations, dropping 83.60 & 87.60 due to lack of shiptime. All station work - CTD-rosette; Bongo, Pairovet, PRPOOS, Manta Net tows; NCOG & DIC sampling were performed. The deepest casts were in Santa Monica Basin to 715m & Santa Barbara Basin to 565m. Primary productivity incubation experiments were not performed this cruise so no prodo data will be available. |
| Data Files: |
1902RL CTD Cast Files, 1902RL Preliminary CTD+Bottle Data Files (preliminary anomaly plots will NOT be presented due to gaps in the data) |
| Announcement: |
CalCOFI |
| Cruise Dates: | Wednesday, 06 Feb 2019 - Wednesday, 13 Feb 2019 |
| Loading: | Mon Dec 17th - Thu Dec 20th 2018 early load & setup, with continued loading & setup Mon-Tue 4-5 Feb 2019 at 10th Ave Marine Terminal*, San Diego, CA. Sail date 0900 06 Feb 2019. *Entry to 10th Ave Marine Terminal & RV Reuben Lasker requires a TWIC card or escort. |
| Offloading: | Thursday, 14 Feb 2019; 10th Ave Marine Terminal, San Diego, CA |
| Partiicpant Forms: | NOAA Medical Forms - required for all cruise participants sailing Jan 05 2019 |
| Ship: | RV Reuben Lasker |
| Station plan: | 31 Stations |
| Cruise Map: |
 |
| Contacts: | Bryan Overcash, Chief Scientist, NMFS |
| Dan Schuller, IOD (SIO Technical Coordinator) | |
Platform: NOAA Ship Reuben Lasker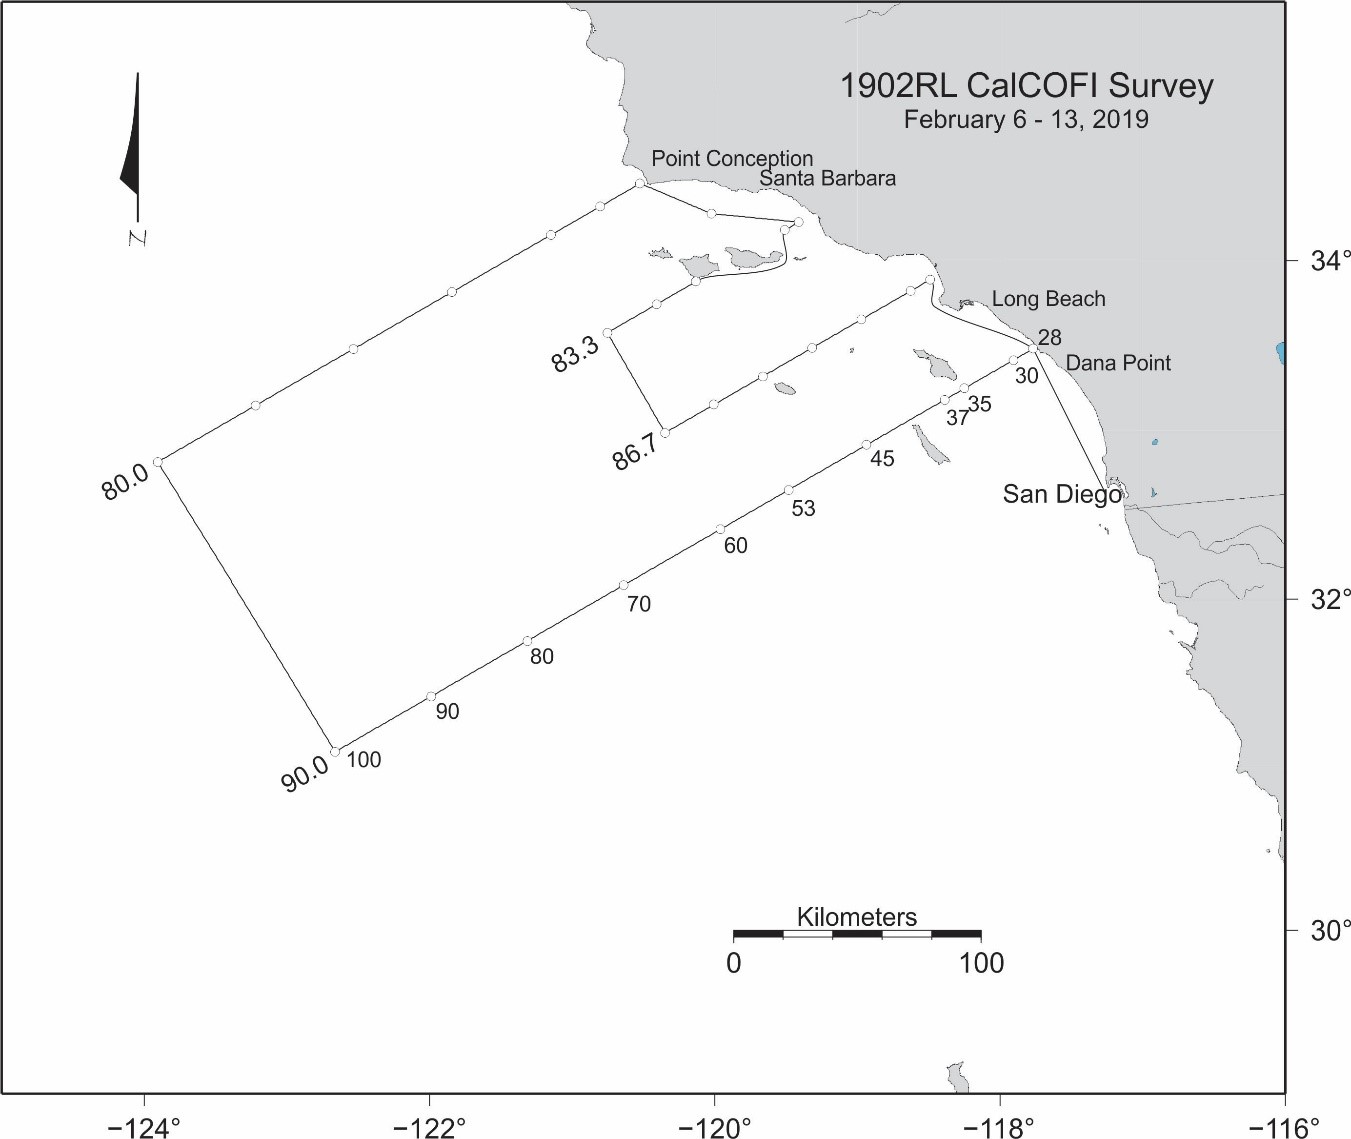
Project Number: RL-19-01 (OMAO), 1902RL (SWFSC)
Project Title: Winter CalCOFI, Fisheries Resources Division.
Project Dates: February 6, 2019 to February 13, 2019
Project Instructions: (Complete PDF)
- Overview
- Brief Summary and Project Period
Survey the distributions and abundances of pelagic fish stocks, their prey, and their biotic and abiotic environments in the area of the California Current between San Francisco, California and San Diego, California during the period of February 6 to February 13, 2019.
- Days at Sea (DAS)
Of the 8 DAS scheduled for this project, 8 are funded by a Line Office Allocation. This project is estimated to exhibit a High Operational Tempo.
- Operating Area
The area covered during this survey will be from San Diego to Point Conception and extend approximately 200 miles offshore (please see appendix section).
- Summary of Objectives
Survey the distributions and abundances of pelagic fish stocks, their prey, and their biotic and abiotic environments in the area of the California Current between Point Conception, California and San Diego, California.
The following are specific objectives for the winter CalCOFI.
I.D.1. Continuously sample pelagic fish eggs using the Continuous Underway Fish Egg Sampler (CUFES). The data will be used to estimate the distributions and abundances of spawning hake, anchovy, mackerel, and early spawning Pacific sardine.
I.D.2. Continuously sample multi-frequency acoustic backscatter using the Simrad EK60/80 and the Simrad ME80. The data will be used to estimate the distributions and abundances of coastal pelagic fishes (e.g., sardine, anchovy, and mackerel), and krill species (please see appendix section).
I.D.3. Continuously sample sea-surface temperature, salinity, and chlorophyll-a using a thermosalinometer and fluorometer. These data will be used to estimate the physical oceanographic habitats for target species.
I.D.4. Continuously sample air temperature, barometric pressure, and wind speed and direction using an integrated weather station.
I.D.5. Sample profiles of seawater temperature, salinity, chlorophyll-a, nutrients, and phytoplankton using a CTD with water-sampling rosette and other instruments at prescribed stations. Measurements of extracted chlorophyll and phaeophytin will be obtained with a fluorometer. Primary production will be measured as C14 uptake in a six hour in situ incubation. Nutrients will be measured with an auto-analyzer.
I.D.6. Sample the light intensity in the photic zone using a standard secchi disk in conjunction with a daytime CTD station. These data will be used to interpret the measurements of primary production.
I.D.7. Sample plankton using a CalBOBL (CalCOFI Bongo Oblique) at prescribed stations. These data will be used to estimate the distributions and abundances of ichthyoplankton and zooplankton species.
I.D.8. Sample plankton using a Manta (neuston) net at prescribed stations. These data will be used to estimate the distributions and abundances of ichthyoplankton species.
I.D.9. Sample the vertically integrated abundance of fish eggs using a Pairovet net at prescribed stations. These data will be used to quantify the abundances and distributions of fish eggs.
I.D.10. Sample plankton using a PRPOOS (Planktonic Rate Processes in Oligotrophic Ocean Systems) net at all prescribed CalCOFI stations on lines 90.0 and 80.0 as well as stations out to and including station 70.0 on lines 86.7 and 83.3 and station 81.8 46.9. These data will be used in analyses by the LTER (Long Term Ecological Research) project.
I.D.11. Continuously sample profiles of currents using the RDI/Teledyne Acoustic Doppler Current Profiler. This will be dependent on the ability to sync the ADCP’s output with the EK60 and ME70. The EK60 and ME70 will hold priority over the ADCP (please see appendix section).
I.D.12. Continuously observe, during daylight hours, seabirds and mammals. These data will be used to estimate the distributions and abundances of seabirds and marine mammals.
- Participating Institutions
I.E.1 Southwest Fisheries Science Center (SWFSC)
I.E.2 Scripps Institution of Oceanography (SIO)
I.E.3 Farallon Institute Advanced Ecosystem Research (FIAER)