CalCOFI 1806SR
- CalCOFI 1806SR • Load & Setup: 06-08 June 2018 • Cruise Dates: 09-24 June 2018 • RV Sally Ride •
| CTD Processing Summary CalCOFI 1806SR CTD Final Data | |||
| Download 1806SR CTD raw cast files zipped | Download 1806SR FinalQC CTD + bottle data | ||
|
General CTD Notes - data acquisition notes, logistics, processing - see below. |
|||
| CTD sensor corrections derived by comparing CTD sensor data, 4sec averages prior-to-bottle closure, to bottle samples | |||
| Dual T, S, & O2 | Primary Sensor | Secondary Sensor | |
| Salinity offset (bottle - CTD salinity; > 350m only; Seabird SBE4) | -0.0045 | -0.0071 | |
| Oxygen ml/L (dual Seabird SBE43) |
y = 1.07x - 0.019 R² = 0.9997 |
y = 1.0306x + 0.0326 R² = 0.9996 |
|
| Oxygen umol/Kg (dual Seabird SBE43) |
y =1.0714x - 0.7035 R² = 0.9997 |
y = 1.032x + 1.543 R² = 0.9996 |
|
| Single sensors | Linear | Polynomial | |
|
Nitrate - ISUS 4sec ave voltage vs Bottle NO3 (Satlantic ISUS v3 SN111) |
y = 27.652x - 10.323 R² = 0.9958 |
||
| Fluorometer - linear & polynomial regressions |
y= 9.6215x - 0.332 R² = 0.868 |
y = 1.3267x2 + 8.7793x - 0.283 R² = 0.8688 |
|
 |
 |
||
 |
 |
||
 |
 |
||
| Summary: |
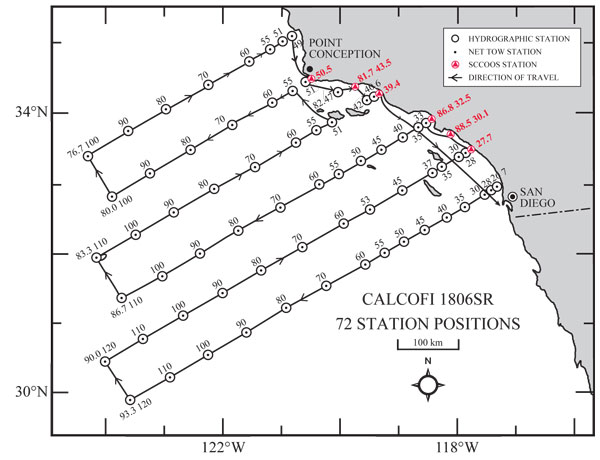
CalCOFI 1806SR sailed June 09 from Nimitz Marine Facilites, Pt Loma on SIO RV Sally Ride. 73 stations were scheduled - two SCCOOS stations, 93.4 26.4 & 91.7 26.4, were not scheduled due to Naval operations that would have required dropping station 90.45 later. 21 scientists, technicians, volunteers, and interns participated. Scheduled unusually early this summer, the weather was moderately-rough for most of the cruise, slowing transits. This resulted in dropping the Pt Dume SCCOOS station on the way home to San Diego. |
| Data Links: | 1806SR CTD Cast Files | 1806SR Preliminary Plots | CTD+bottle Preliminary CTD.csvs & files |
| Project: | CalCOFI 1806SR |
| Cruise Dates: | Depart Sat 0800 09 Jun, Return Sun 24 Jun 2018 |
| Load Dates: | Loading and setup: 06 - 08 Jun 2018 (Wed-Fri) at Nimitz Marine Facility (MarFac) San Diego. RV Sally Ride had an open house with tours Jun 7 for UCSD Foundation members & guests. |
| Offload Date: | 25 Jun 2018 (Mon) at MarFac |
| Ship: | SIO R/V Sally Ride |
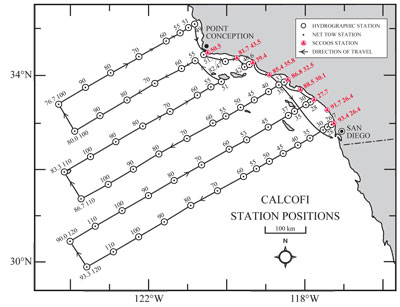
| Station plan: | 73 Standard (66 CalCOFI + 7 SCCOOS); Predicted Sta Schedule & Cruise Instructions |
| Cruise Forms: | Ship Scheduling User Portal; Please login and fill out the mandatory participants forms |
| Cruise Map: |
 |
| Contacts: | Jennifer Rodgers-Wolgast, Chief Scientist, SIO-IOD |
| Bryan Overcash, NMFS(Fisheries Technical Coordinator); Amy Hays, NMFS |
Date Created: 21 May 2018
Platform: R/V Sally Ride
Project Number: CalCOFI 1806SR; UNOLS SR1808
Project Title: CalCOFI Summer Survey.
Project Dates: 09 to 24 June 2018
Prepared by: Jennifer Rodgers-Wolgast, Chief Scientist, and James R Wilkinson, Integrative Oceanography Division, Scripps Institution of Oceanography
Dated: 21 May 2018
PDFs:
I. Overview
- Brief Summary and Project Period: Survey the distributions and abundances of pelagic fish stocks, their prey, and their biotic and abiotic environments in the area of the California Current between San Diego, California and Avila Beach, California during the period of 09-24 Jun 2018.
- Operating Area: From San Diego, CA to Avila Beach, CA and out 300 nautical miles. Please refer to Station Order & Coordinates PDF
Please note that the anomalies are based on 50-year harmonics (1949-1999) and these data are 1m binavg Seasoft-processed CTD data that have not gone through thorough quality control checks or bottle corrections. They are presented to give a general impression of current conditions. Final data plots will be published after all data are processed.
| 10 & 100 meter Preliminary CTD Data & Anomaly (50yr mean) Contours (Click for larger image) | ||
 |
 |
 |
 |
 |
 |
 |
 |
 |
 |
 |
 |
 |
 |
 |
| 200 meters (Click for larger image) | ||
 |
 |
 |
 |
 |
 |
| 300 meter (Click for larger image) | ||
 |
 |
 |
 |
 |
 |
 |
 |
 |