CalCOFI 1804SH
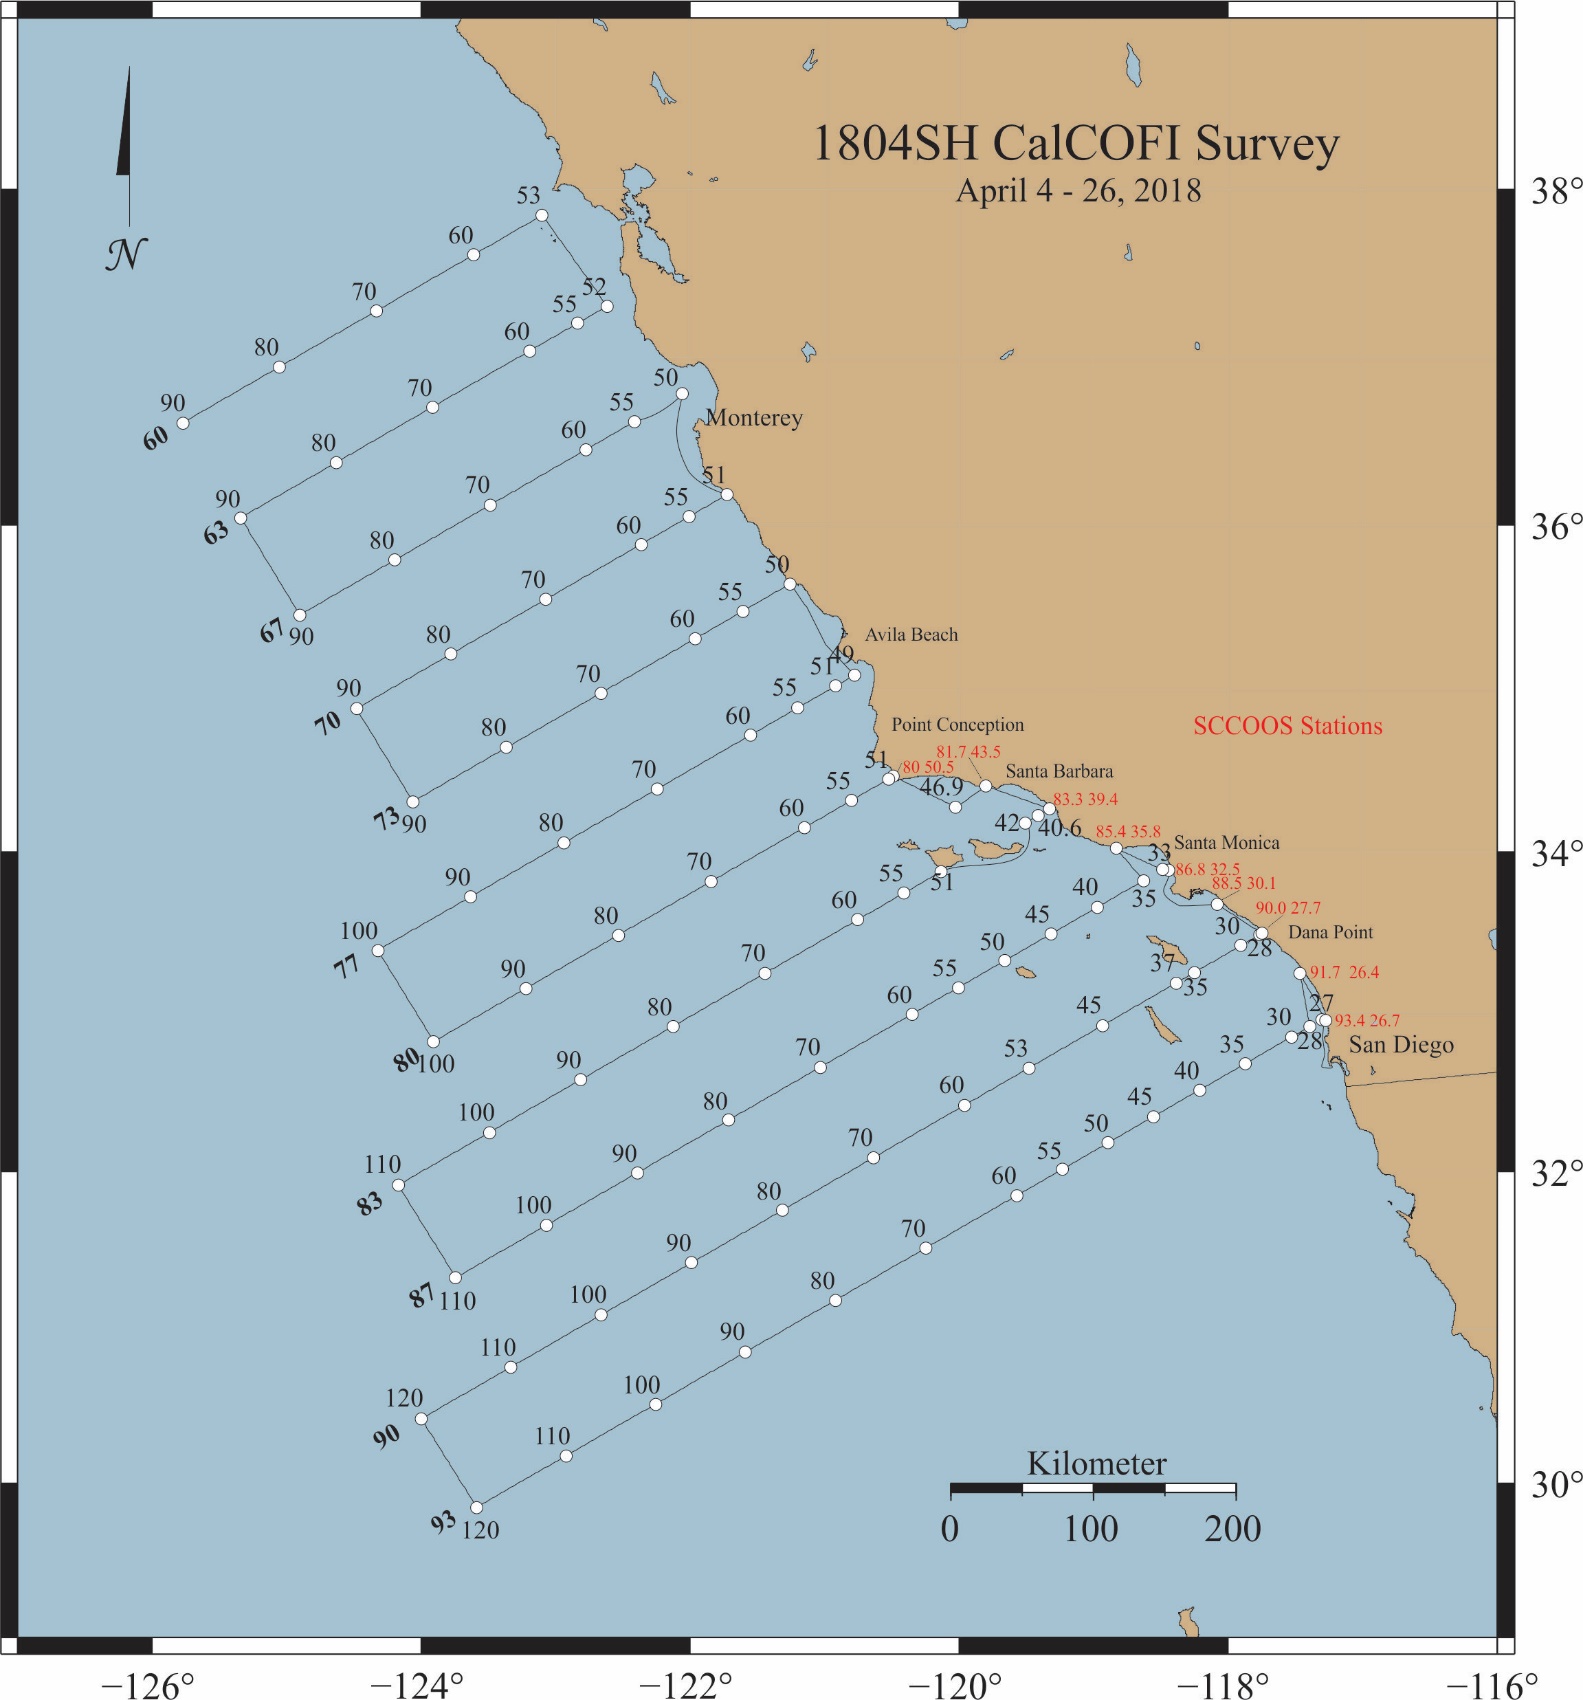
- CalCOFI 1804SH • 05 - 27 Apr 2018 (Thu-Fri; 23 DAS) • FSV Bell M Shimada • Load & Setup: 03-04 Apr 2018, 10th Ave Marine Terminal, San Diego • Offload 27-28 Apr 2018 San Francisco
| CTD Processing Summary CalCOFI 1804SH CTD FinalQC Data | |||
| Download 1804SH CTD raw cast files zipped | Download 1804SH FinalQC CTD + bottle data | ||
|
General CTD Notes - data acquisition notes, logistics, processing - see below. |
|||
| CTD sensor corrections derived by comparing CTD sensor data, 4sec averages prior-to-bottle closure, to bottle samples | |||
| Dual T, S, & O2 | Primary Sensor | Secondary Sensor | |
| Salinity offset (bottle - CTD salinity; > 350m only; Seabird SBE4) | 0.0017 | -0.0006 | |
| Oxygen ml/L (dual Seabird SBE43) |
y = 1.064x - 0.0086 R² = 0.9996 |
y = 1.0212x + 0.0408 R² = 0.9996 |
|
| Oxygen umol/Kg (dual Seabird SBE43) |
y =1.0666x - 0.2788 R² = 0.9996 |
y = 1.0238x + 1.8748 R² = 0.9996 |
|
| Single sensors | Linear | Polynomial | |
|
Nitrate - ISUS 4sec ave voltage vs Bottle NO3 (Satlantic ISUS v3 SN111) |
y = 27.891x - 10.453 R² = 0.9943 |
||
| Fluorometer - linear & polynomial regressions |
y= 14.841x - 0.6679 |
y = 1.8668x2 + 13.009x - 0.5375 |
|
 |
 |
||
 |
 |
||
 |
 |
||
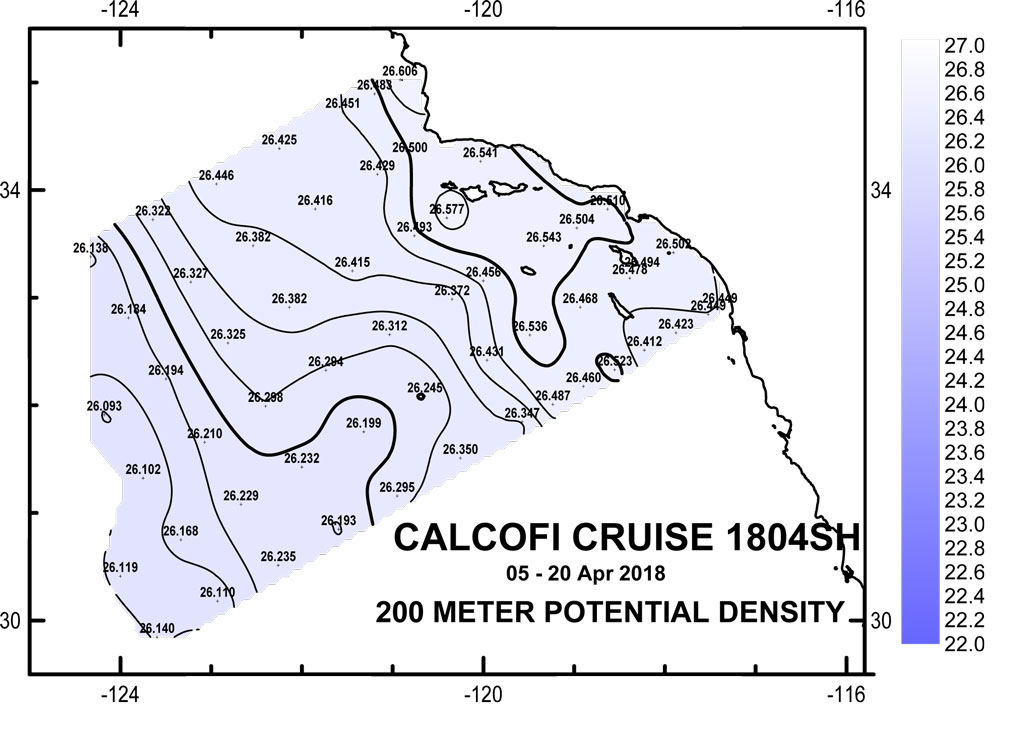
Please note that the anomalies are based on 50-year harmonics (1949-1999) and these data are 1m binavg Seasoft-processed CTD data that have not gone through thorough quality control checks or bottle corrections. They are presented to give a general impression of current conditions. CalCOFI 1804SH has additional northern stations but these represent the 75 standard stations occupied 05-20 Apr 2018.
| 10 & 100 meter Preliminary CTD Data & Anomaly (50yr mean) Contours (Click for larger image) | ||
 |
 |
 |
 |
 |
 |
 |
 |
 |
 |
 |
 |
 |
 |
 |
| 200 meters (Click for larger image) | ||
 |
 |
 |
 |
 |
 |
| 300 meter (Click for larger image) | ||
 |
 |
 |
 |
 |
 |
 |
 |
 |
 Date Created: February 27, 2018
Updated: March 15, 2018
Platform: NOAA Ship FSV Bell M Shimada
Project Number: CalCOFI 1804SH (OMAO SH-18-03)
Project Title: Spring 2018 CalCOFI Survey, Fisheries Resources Division
Project Dates: April 5 2018 to April 27 2018
MOB Dates: April 02 - 04 2018
DOB Dates: April 27-28 2018, San Francisco CA
Prepared by: Bryan Overcash, Chief Scientist
- Cruise Instructions PDF (pending);
- Station Order & Coordinates;
- Chemical Inventory
- Station Activities
- Predicted Station Schedule (pending)
-
Overview
-
Brief Summary and Project Period:
Survey the distributions and abundances of pelagic fish stocks, their prey, and their biotic and abiotic environments in the area of the California Current between San Francisco, California and San Diego, California during the period of April 5 to April 27, 2018. -
Days at Sea (DAS)
Of the 23 DAS scheduled for this project, 23 are funded by a Line Office Allocation. This project is estimated to exhibit a High Operational Tempo. -
Operating Area
The area covered during this survey will be from San Diego to San Francisco and extend approximately 200 miles offshore (please see appendices 1b & 2a). -
Summary of Objectives
Survey the distributions and abundances of pelagic fish stocks, their prey, and their biotic and abiotic environments in the area of the California Current between San Francisco, California and San Diego, California.
The following are specific objectives for the winter CalCOFI.- . Continuously sample pelagic fish eggs using the Continuous Underway Fish Egg Sampler (CUFES). The data will be used to estimate the distributions and abundances of spawning pacific hake, northern anchovy, mackerel, and Pacific sardine.
- Continuously sample multi-frequency acoustic backscatter using the Simrad EK60 and the Simrad ME70. The data will be used to estimate the distributions and abundances of coastal pelagic fishes (e.g., sardine, anchovy, and mackerel), and krill species.
- Continuously sample sea-surface temperature, salinity, and chlorophyll-a using a thermosalinometer and fluorometer. These data will be used to estimate the physical oceanographic habitats for target species.
- Continuously sample air temperature, barometric pressure, and wind speed and direction using an integrated weather station.
- Sample profiles of seawater temperature, salinity, chlorophyll-a, nutrients, and phytoplankton using a CTD with water-sampling rosette and other instruments at prescribed stations. Measurements of extracted chlorophyll and phaeophytin will be obtained with a fluorometer. Primary production will be measured as C14 uptake in a six hour in situ incubation. Nutrients will be measured with an auto-analyzer. These data will be used to estimate primary productivity and the biotic and abiotic habitats for target species.
- Sample the light intensity in the photic zone using a standard secchi disk once per day in conjunction with a daytime CTD station. These data will be used to interpret the measurements of primary production.
- Sample plankton using a CalBOBL (CalCOFI Bongo Oblique) at prescribed stations. These data will be used to estimate the distributions and abundances of ichthyoplankton and zooplankton species.
- Sample plankton using a Manta (neuston) net at prescribed stations. These data will be used to estimate the distributions and abundances of ichthyoplankton species.
- Sample the vertically integrated abundance of fish eggs using a Pairovet net at prescribed stations. These data will be used to quantify the abundances and distributions of fish eggs.
- Sample plankton using a PRPOOS (Planktonic Rate Processes in Oligotrophic Ocean Systems) net at all prescribed CalCOFI stations on lines 90.0 and 80.0 as well as stations out to and including station 70.0 on lines 86.7 and 83.3 and station 81.8 46.9. PRPOOS will not be towed on SCCOOS stations. These data will be used in analyses by the LTER (Long Term Ecological Research) project.
- Continuously sample profiles of currents using the RDI/Teledyne Acoustic Doppler Current Profiler. This will be dependent on the ability to sync the ADCP’s output with the EK60 and ME70. The EK60 and ME70 will hold priority over the ADCP.
- Continuously observe, during daylight hours, seabirds and mammals. These data will be used to estimate the distributions and abundances of seabirds and marine mammals.
-
Participating Institutions
- Southwest Fisheries Science Center (SWFSC)
- Scripps Institution of Oceanography (SIO)
- Farallon Institute Advanced Ecosystem Research (FIAER)
-
Brief Summary and Project Period: