CalCOFI 1704SH
| Summary: | CalCOFI 1704SH - 28 Mar - 20 Apr 2017, 104 stations occupied; sailed from 10th Ave Marine Terminal at 1600PDT 28 Mar 2017. All scheduled stations were successfully occupied - 82 stations on Leg I, 22 on Leg II. Personnel were exchanged at Monterey 15 Apr 2017 at 0900PDT. Other than rough weather three days into the cruise slowing station transits, station operations were performed without issues. With fewer analytical personnel aboard, Leg II's CTD-rosette seawater sampling depths were reduced to 12 versus Leg I's 20-24 sampled depths. |
| Data Files: | 1704SH CTD Raw Cast Files; 1704SH FINAL CTD+Bottle Files |
| Announcement: | CalCOFI 1704SH Final Cruise Instructions |
| Cruise Dates: | Leg I: Tuesday, 28 Mar 2017 - ~Saturday 15 Apr 2017, San Diego to Monterey CA |
| Leg II: ~Saturday 15 Apr - Friday 21 Apr 2017, Monterey to San Francisco CA | |
| Loading: | Saturday 25 Mar - Monday 27 Mar 2017 at 10th Ave Marine Terminal, San Diego, CA |
| Offloading: | Friday 21 Apr - Sunday 23 Apr 2017 in San Francisco; location Pier30/32 |
| Partiicpant Forms: | NOAA Medical Forms - required for all cruise participants sailing 28 Mar 2017 |
| Ship: | RV Bell M Shimada |
| Station plan: | 104 Stations (95 CalCOFI + 9 SCCOOS) |
| Cruise Map: |
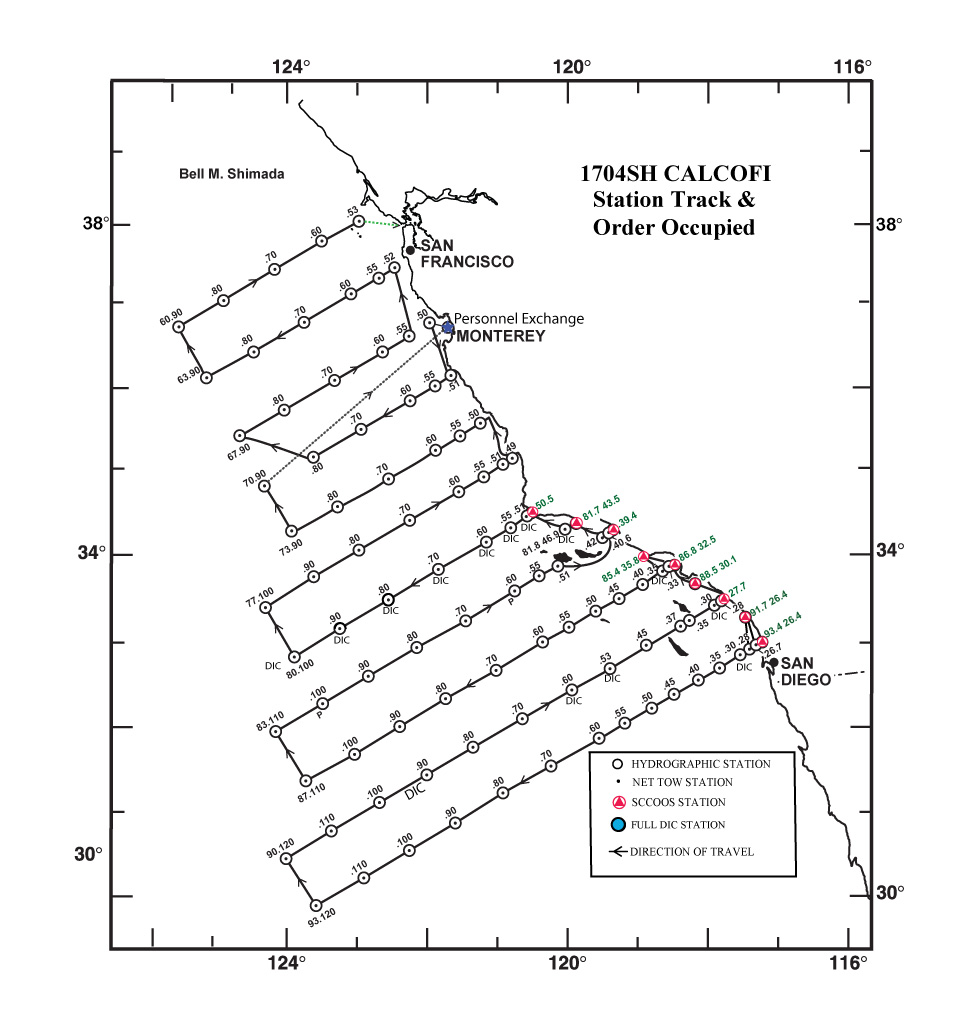 |
| Contacts: | Amy Hays, Chief Scientist, NMFS |
| Dan Schuller, IOD (SIO Technical Coordinator) | |
| CTD Processing Summary CalCOFI 1704SH CTD Final Data | |||
| Download 1704SH CTD raw cast files zipped | Download 1704SH Final CTD + bottle data | ||
|
General CTD Notes - data acquisition notes, logistics, processing - see below. |
|||
| CTD sensor corrections derived by comparing CTD sensor data, 4sec average prior to bottle closure, to bottle samples | |||
| Dual T, S, & O2 | Primary Sensor | Secondary Sensor | |
| Salinity offset (bottle - CTD salinity; > 350m only; Seabird SBE4) | 0.0030 | 0.0025 | |
| Oxygen ml/L (dual Seabird SBE43; 2° O2 Calib Off) |
y = 1.0991x+0.0104 R² = 0.9996 |
y = 1.0395x - 0.0042 R² = 0.9994 |
|
| Oxygen umol/Kg (dual Seabird SBE43; 2° O2 Calib Off) |
y =1.1019x+0.5443 R² = 0.9996 |
y = 1.0422x - 0.0953 R² = 0.9995 |
|
| Single sensors | Linear | Polynomial | |
|
Nitrate - ISUS 4sec ave voltage vs Bottle NO3 (Frank's Satlantic ISUS v3) Cast 001 - 040 |
y = 28.453x - 2.2134 R² = 0.9797 |
||
| Nitrate - ISUS 4sec ave voltage vs bottle NO3; Cast 041 - 104 |
y = 29.962x+0.2836 R² = 0.9881 |
||
| Fluorometer - linear & polynomial regressions |
y=15.478x-0.7205 R² = 0.8789 |
y = 5.8815x2 + 11.488x - 0.4781 R² = 0.8976 |
|
 |
 |
||
 |
 |
||
 |
 |
||
Please note that the anomalies are based on 50-year harmonics (1949-1999) and these data are 1m binavg Seasoft-processed CTD data that have not gone through thorough quality control checks or bottle corrections. They are presented to give a general impression of current conditions. Final data plots will be published after all data are processed.
| 10 & 100 meter Preliminary CTD Data & Anomaly (50yr mean) Contours (Click for larger image) | ||
 |
 |
 |
 |
 |
 |
 |
 |
 |
 |
 |
 |
 |
 |
 |
| 200 meters (Click for larger image) | ||
 |
 |
 |
 |
 |
 |
| 300 meter (Click for larger image) | ||
 |
 |
 |
 |
 |
 |
")
Final Project Instructions (click for full pdf)
Date Submitted: February 7, 2017
Platform: NOAA Ship Bell M. Shimada
Project Number: SH-17-04 (OMAO), 1704SH (SWFSC)
Project Title: Spring CalCOFI and Saildrone Ground Truthing, SWFSC/PMEL
Project Dates: March 19, 2017 to April 21, 2017
I. Overview
A. Brief Summary and Project Period
I.A.1. Survey the distributions and abundances of pelagic fish stocks, their prey, and their biotic and abiotic environments in the area of the California Current between San Francisco, California and San Diego, California during the period of March 28 to April 21, 2017.
I.A.2. Ground truth the Saildrone UAS instrument suite with the Shimada.
B. Days at Sea (DAS)
I.B.1. Of the 31 DAS scheduled for this project, 25 are funded by a Line Office Allocation according to the Fleet Allocation Plan. This project is estimated to exhibit a High Operational Tempo.
I.B.2. 1 UxS day is funded for OAR-PMEL to run instrument comparisons between the SHIMADA and a Carbon Saildrone.
I.B.3 5 days are funded for OMAO for transit from Newport, Oregon to San Diego, California.
C. Operating Area
I.C.1. The area covered during this survey will be from San Diego to San Francisco and extend approximately 200 miles offshore (please see appendices 1b & 2a).
I.C.2. UxS Saildrone: The SHIMADA – Saildrone comparison will take place somewhere along the CA coast between San Francisco and Santa Barbara in less than 300m water depth. The exact location will be determined based on observations from SH-17-02. The requirements are an area with fish aggregates in the water column in less than 300m.
D. Summary of Objectives
Survey the distributions and abundances of pelagic fish stocks, their prey, and their biotic and abiotic environments in the area of the California Current between San Francisco, California and San Diego, California.
The following are specific objectives for the spring CalCOFI.
I.D.1. Continuously sample pelagic fish eggs using the Continuous Underway Fish Egg Sampler (CUFES). The data will be used to estimate the distributions and abundances of spawning hake, anchovy, mackerel, and Pacific sardine.
I.D.2. Continuously sample sea-surface temperature, salinity, and chlorophyll-a using a thermosalinometer and fluorometer. These data will be used to estimate the physical oceanographic habitats for target species.
I.D.3. Continuously sample air temperature, barometric pressure, and wind speed and direction using an integrated weather station.
I.D.4. Sample profiles of seawater temperature, salinity, chlorophyll-a, nutrients, and phytoplankton using a CTD with water-sampling rosette and other instruments at prescribed stations. Measurements of extracted chlorophyll and phaeophytin will be obtained with a fluorometer. Primary production will be measured as C14 uptake in a six hour in situ incubation. Nutrients will be measured with an auto-analyzer. These data will be used to estimate primary productivity and the biotic and abiotic habitats for target species.
I.D.5. Sample the light intensity in the photic zone using a standard Secchi disk once per day in conjunction with a daytime CTD station. These data will be used to interpret the measurements of primary production.
I.D.6. Sample plankton using a CalBOBL (CalCOFI Bongo Oblique) at prescribed stations. These data will be used to estimate the distributions and abundances of ichthyoplankton and zooplankton species.
I.D.7. Sample plankton using a Manta (neuston) net at prescribed stations. These data will be used to estimate the distributions and abundances of ichthyoplankton species.
I.D.8. Sample the vertically integrated abundance of fish eggs using a Pairovet net at prescribed stations. These data will be used to quantify the abundances and distributions of fish eggs.
I.D.9. Sample plankton using a PRPOOS (Planktonic Rate Processes in Oligotrophic Ocean Systems net) at all prescribed CalCOFI stations on lines 90.0 and 80.0 as well as stations out to and including station 70.0 on lines 86.7 and 83.3 and station 81.8 46.9. PRPOOS will not be towed on SCCOOS stations. These data will be used in analyses by the LTER (Long Term Ecological Research) project.
I.D.10. Continuously sample profiles of currents using the RDI/Teledyne Acoustic Doppler Current Profiler.
I.D.11. Continuously observe, during daylight hours, seabirds and mammals. These data will be used to estimate the distributions and abundances of seabirds and marine mammals.
I.D.12. Conduct 24 hrs of Saildrone comparison operations to validate carbon, fisheries acoustics, ADCP, oceanographic, and meteorological sensors integrated onto the Saildrone UAS.