CalCOFI 1611SR
| Project: | CalCOFI 1611SR (UNOLS SR1608) |
| Summary: | CalCOFI 1611SR sailed from SIO's Nimitz Marine Facility San Diego Nov 06 2016 at 0800PST and returned as scheduled 0800 Nov 22 2016. Offloading started upon arrival to San Diego. 75 of 75 scheduled stations (66 standard and 9 SCCOOS stations) were successfully occupied. Please refer to the preliminary data plots web page and data links below for preliminary data. The typical 75-station summer station pattern was scheduled but due to high winds and rough seas on Line 83, we worked along the coast before heading to Line 80. During this time, all net tows on stations 80.70, 80.60, 80.55, and 80.51 (Manta only) were cancelled. CTD-rosette casts were done only because the RV Sally Ride's LARS system could safely deploy and recover the rosette. On any other ship, we would have cancelled all operations due to near-gale force winds and rough seas. After completing station 77.49, we were able to recover net tows (Bongo, Pairover, Manta) on stations 80.60 & 80.55. So all net tows on sta 80.70 were missed and the Manta tow on sta 80.51. |
| Data files/links: | 1611SR Raw CTD Cast Files; Prelim. CTD+Bottle Data Files; Prelim. Horizontal Contour Plots |
| Cruise Dates: | Depart 0800 06 Nov, Return 0800 22 Nov 2016 (Sun-Tue) |
| Load Dates: | 03 - 05 Nov 2016 (Thu-Sat) at Nimitz Marine Facility (MarFac) San Diego |
| Offload Date: | 22 Nov 2016 (Tue); upon arrival to MarFac |
| Ship: | SIO R/V Sally Ride |
| Station plan: | 75 Standard (66 CalCOFI + 9 SCCOOS); Predicted Sta Schedule; Cruise Instructions |
| Cruise Forms: | Ship Scheduling User Portal; Please login and fill out the mandatory participants forms |
| Cruise Map: | 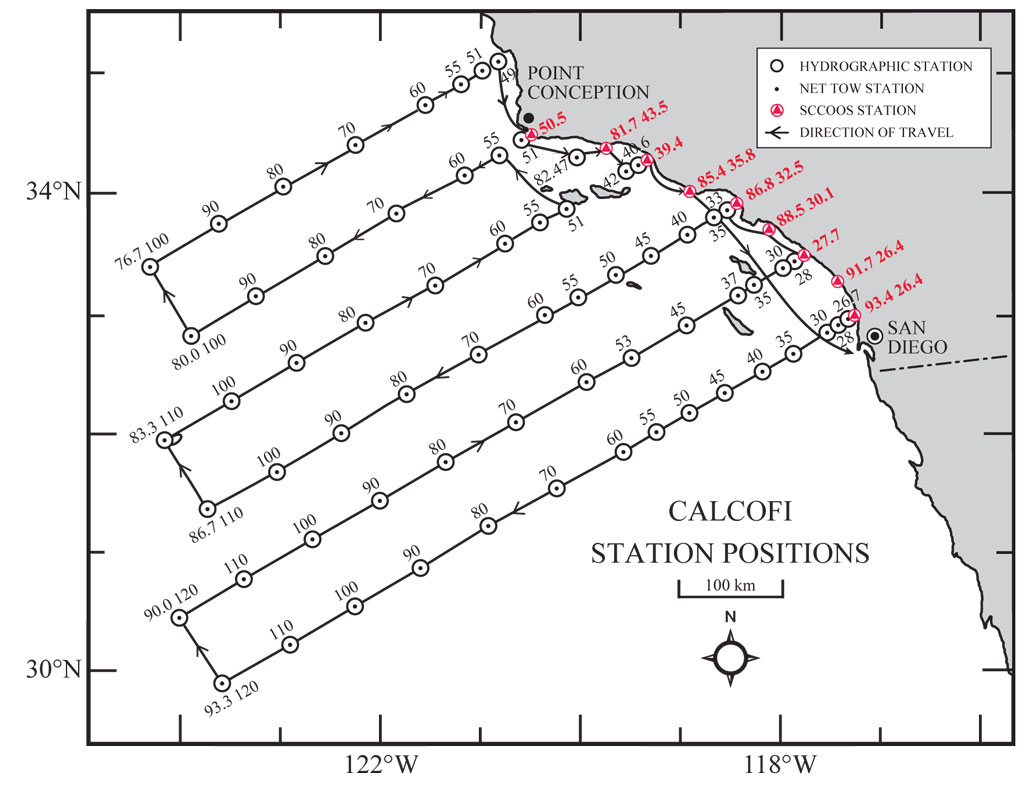 |
| Contacts: | James Wilkinson, Chief Scientist, SIO-IOD |
| Dave Griffith, NMFS (Fisheries Technical Coordinator); Bryan Overcash, NMFS, Cruise leader |
| CTD Processing Summary CalCOFI 1611SR CTD Final Data | |||
| Download 1611SR CTD raw cast files zipped | Download 1611 FinalQC CTD + bottle data | ||
| General CTD Notes - data acquisition notes, logistics, processing - see below. Please note that these regressions are generated from final CTD vs bottle data that were merged once final bottle data became available. CTD temperatures and salinities may not have significantly change but oxygens, particularly the RINKO III secondary oxygen data, estimated chlorophyll-a, estimated nitrate may change significantly. Questionable or mistrip bottle data were flagged and not used for these comparisons. For this cruise and future cruises, both primary & secondary sensor profiles vs bottle data have been generated and archived in the downloadable CTD+Bottle data files. These plots are under the "csv-plots\primary_plots" & "csv-plots\secondary_plots" subdirectories. |
|||
| CTD sensor corrections are derived by comparing CTD sensor data, 4sec average prior to bottle closure, to bottle samples | |||
| Dual T, S, & O2 | Primary Sensor | Secondary Sensor | RINKO III |
| Salinity offset (bottle - CTD salinity; > 350m only; Seabird SBE4) | -0.0017 | -0.0051 | |
| Oxygen ml/L (dual Seabird SBE43 on 27 stations; 1-SBE43 & 1- RINKO III on 48 stas, RINKO O2 data available now) | y = 0.9944x + 0.0381 R² = 0.9996 |
y = 1.0202x + 0.0229 R² = 0.9997 |
y = 1.0048x - 0.0123 R² = 0.9991 |
| Oxygen umol/Kg (dual Seabird SBE43) | y = 0.9955x+1.799 R² = 0.9995 |
y = 1.0215x + 1.1389 R² = 0.9996 |
y = 1.006x - 0.4022 R² = 0.9991 |
| Single sensors | Linear | Polynomial | |
| Nitrate - ISUS 4sec ave voltage vs Bottle Nitrate (Satlantic MBARI-ISUS v2) | y = 32.82x - 1.3189 R² = 0.9627 |
||
| Fluorometer - linear & polynomial regressions |
y = 9.8936x - 0.3938 R² = 0.7413 |
y = 28.418x2 + 1.7009x - 0.0322 R² = 0.8035 |
|
 |
 |
||
 |
 |
||
 |
 |
||
 |
 |
||
 Date Submitted: Oct 06, 2016
Platform: R/V Sally Ride
Project Number: UNOLS SR1611; CalCOFI 1611SR
Project Title: CalCOFI Fall Survey.
Project Dates: Nov 6, 2016 to Nov 22, 2016
Prepared by: James R Wilkinson Chief Scientist, Integrative Oceanography Division, Scripps Institution of Oceanography
Dated: Oct 06, 2016
PDFs:
- Cruise Instructions;
- Station Order & Coordinates;
- Chemical Inventory
- Station Activities
- Predicted Station Schedule
I. Overview
- Brief Summary and Project Period: Survey the distributions and abundances of pelagic fish stocks, their prey, and their biotic and abiotic environments in the area of the California Current between San Diego, California and Avila Beach, California during the period of Nov 06 - 22, 2016.
- Operating Area: From San Diego, CA to Avila Beach, CA and out 300 nautical miles. Please refer to Station Order & Coordinates PDF
- Summary of Objectives: Survey the distributions and abundances of pelagic fish stocks, their prey, and their biotic and abiotic environments in the area of the California Current between San Diego, California and Avila Beach, California.
- I.C.1. Continuously sample multi-frequency acoustic backscatter using the Simrad EK80. The data will be used to estimate the distributions and abundances of coastal pelagic fishes (e.g., sardine, anchovy, and mackerel), and krill species.
- I.C.2. Continuously sample sea-surface temperature, salinity, and chlorophyll-a using a thermosalinometer. These data will be used to estimate the physical oceanographic habitats for target species.
- I.C.3. Continuously sample air temperature, barometric pressure, and wind speed and direction using an integrated weather station.
- I.C.4. Sample profiles of seawater temperature, salinity, chlorophyll-a, nutrients, and phytoplankton using a CTD with water-sampling rosette and other instruments at prescribed stations. Measurements of extracted chlorophyll and phaeophytin will be obtained with a fluorometer. Primary production will be measured as C14 uptake in a six hour in situ incubation. Nutrients will be measured with an auto-analyzer. These data will be used to estimate primary productivity and the biotic and abiotic habitats for target species.
- I.C.5. Sample the light intensity in the photic zone using a standard secchi disk once per day in conjunction with a daytime CTD station. These data will be used to interpret the measurements of primary production.
- I.C.6. Sample plankton using a CalBOBL (CalCOFI Bongo Oblique) at prescribed stations. These data will be used to estimate the distributions and abundances of ichthyoplankton and zooplankton species.
- I.C.7. Sample plankton using a Manta (neuston) net at prescribed stations. These data will be used to estimate the distributions and abundances of ichthyoplankton species.
- I.C.8. Sample the vertically integrated abundance of fish eggs using a Pairovet net at prescribed stations. These data will be used to quantify the abundances and distributions of fish eggs.
- I.C.9. Sample plankton using a PRPOOS (Planktonic Rate Processes in Oligotrophic Ocean Systems net) at all prescribed CalCOFI stations on lines 90.0, 86.7, 83.3 and 80.0 only. These data will be used in analyses by the LTER (Long Term Ecological Research) project.
- I.C.10. Continuously observe, during daylight hours, seabirds and mammals. These data will be used to estimate the distributions and abundances of seabirds and marine mammals.
- Participating Institutions
- I.D.1 Southwest Fisheries Science Center (SWFSC)
- I.D.2 Scripps Institution of Oceanography (SIO)
Please note that the anomalies are based on 50-year harmonics (1949-1999) and these data are 1m binavg Seasoft-processed CTD data that have not gone through thorough quality control checks or bottle corrections. They are presented to give a general impression of current conditions. Final data plots will be published after all data are processed.
| 10 & 100 meter Preliminary CTD Data & Anomaly (50yr mean) Contours (Click for larger image) | ||
 |
 |
 |
 |
 |
 |
 |
 |
 |
 |
 |
 |
 |
 |
 |
| 200 meters (Click for larger image) | ||
 |
 |
 |
 |
 |
 |
| 300 meter (Click for larger image) | ||
 |
 |
 |
 |
 |
 |