CalCOFI 1601RL
| Summary: |
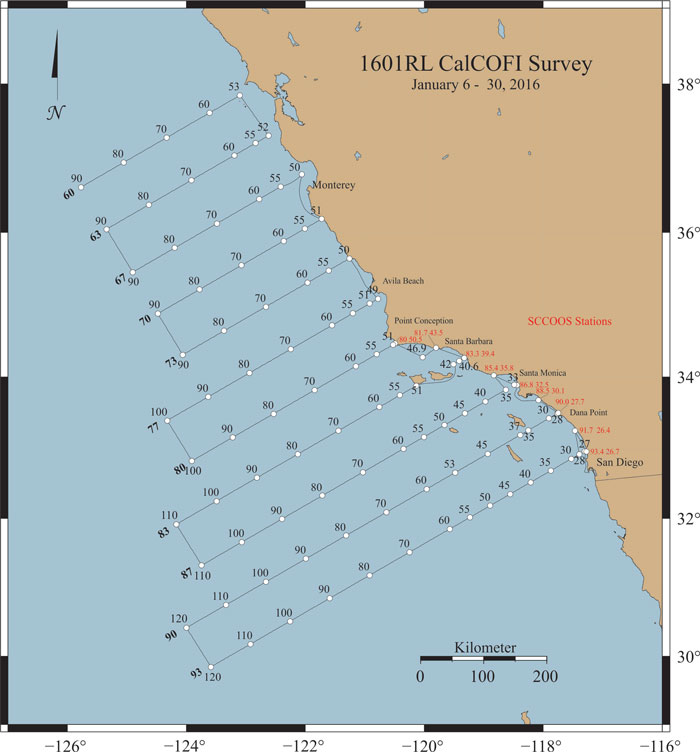
CalCOFI 1601RL successfully completed all 104 scheduled stations, 95 standard & 9 SCCOOS. NOAA RV Reuben Lasker sailed Jan 6th, performing an acoustic calibration in San Diego Bay anchorage off Shelter Island. High winds and stormy weather Jan 6th postponed departure out of San Diego Bay until daybreak Jan 7th. The station order was standard south-north, west-east-west. After 74 southern stations were completed at 76.7 49.0, the CTD-rosette seawater sampling reduced from 24 to 12 bottles. After sta 70.0 51.0, most of the SIO scientific personnel disembarked in Monterey. The Pt Dume SCCOOS station at 85.4 35.8 was occupied last, during the transit home as sta 104. |
| Data Files & Links: | 1601RL CTD raw cast files zipped; 1601 FinalQC CTD + bottle data ; Preliminary Contour Plots |
| Announcement: | CalCOFI 1601RL Cruise Instructions |
| Cruise Dates: | Wednesday, 06 Jan 2016 - Saturday, 30 Jan 2016 |
| Loading: | Monday, 04 Jan 2016 - Tuesday, 05 Jan 2016 ; 10th Ave Marine Terminal, San Diego, CA |
| Offloading: | 01 Feb 2016; 10th Ave Marine Terminal, San Diego, CA |
| Partiicpant Forms: | NOAA Medical Forms - required for all cruise participants sailing Jan 06 2016 |
| Ship: | RV Reuben Lasker |
| Station plan: | 104 Stations (95 CalCOFI + 9 SCCOOS) |
| Cruise Map: | 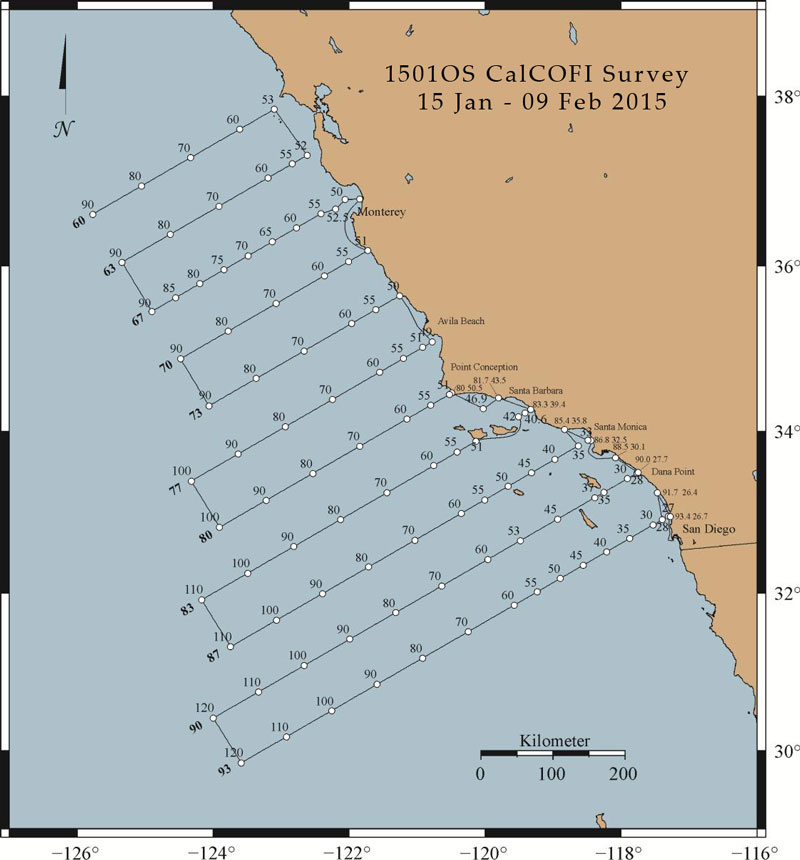 |
| Contacts: | Dave Grifftith, Chief Scientist, NMFS |
| James R Wilkinson, IOD (SIO Technical Coordinator) |
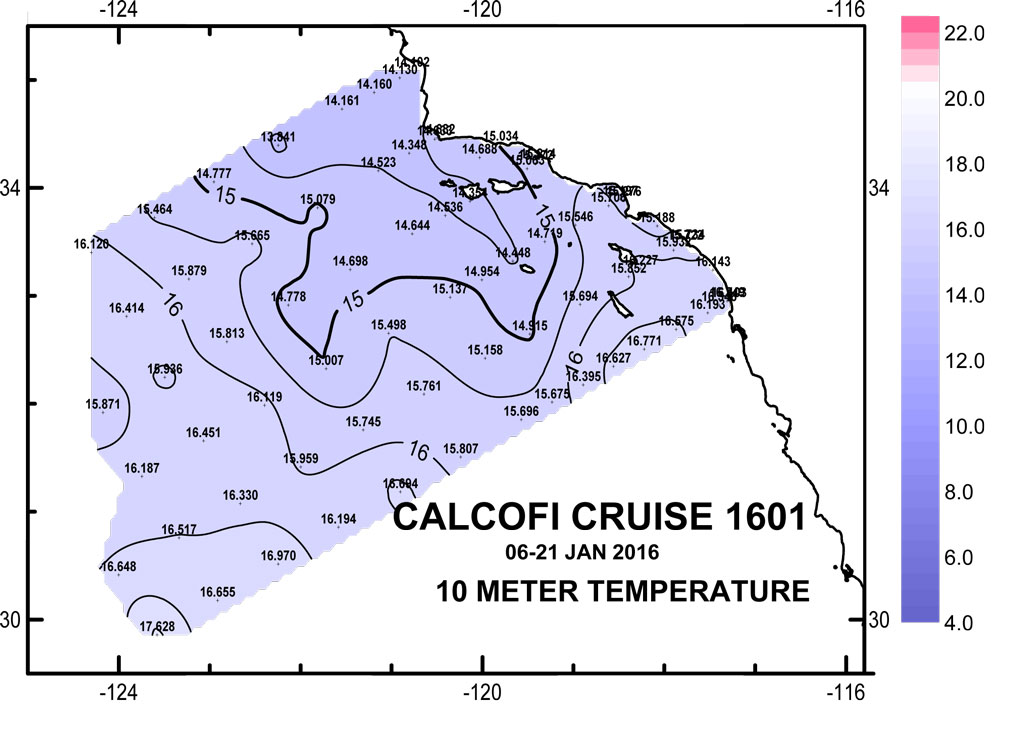
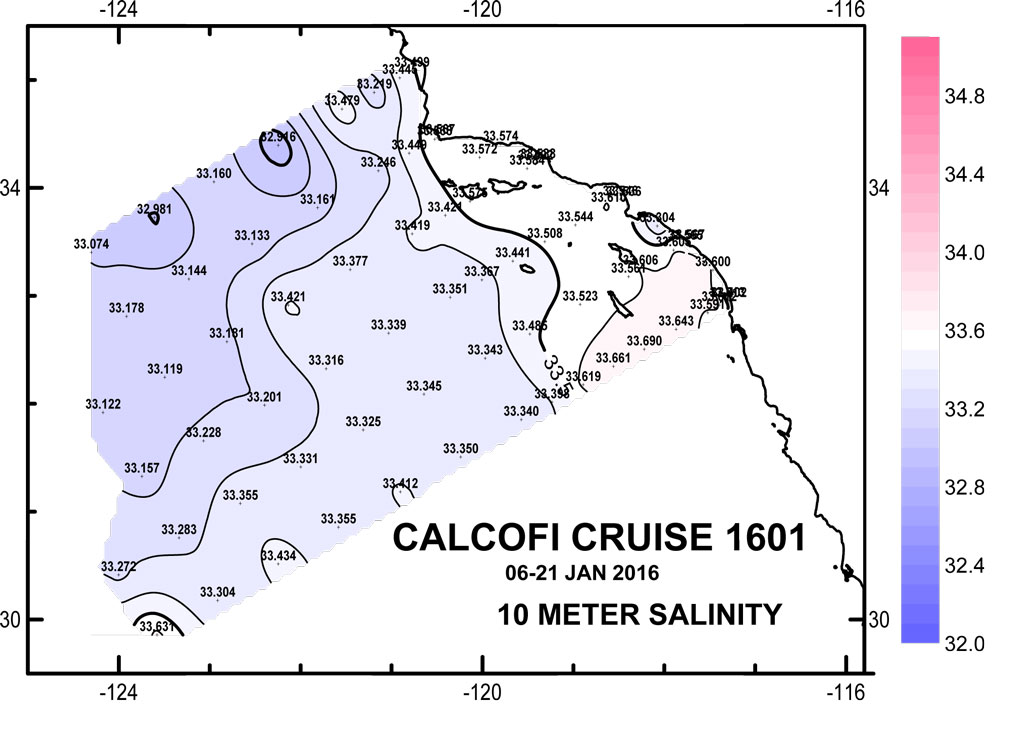
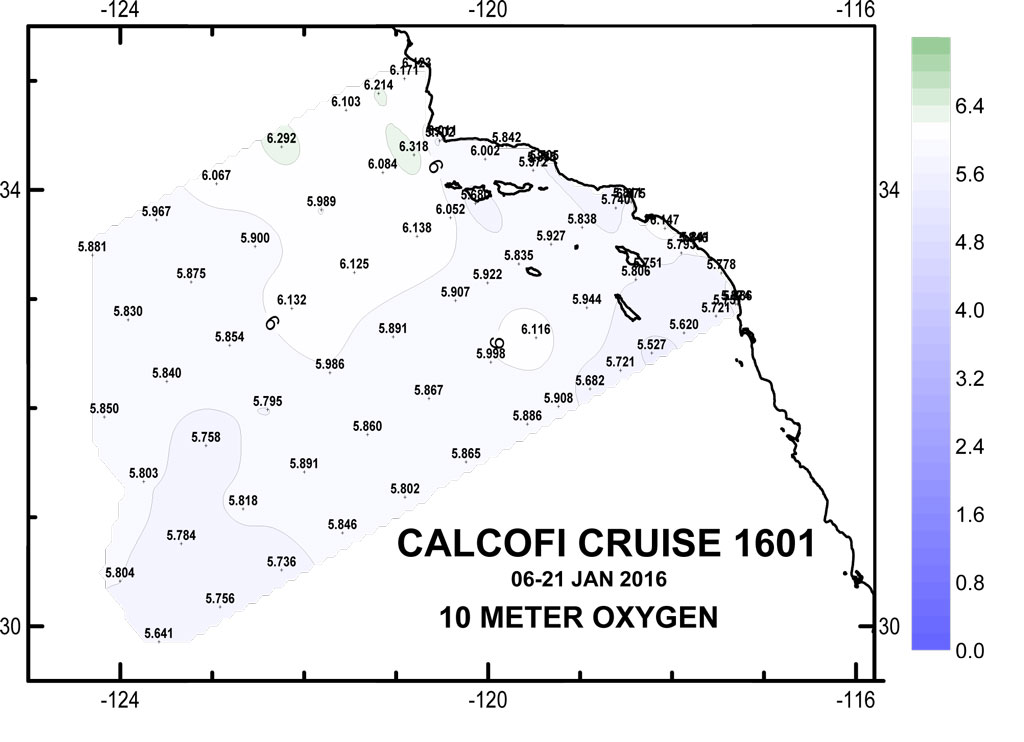
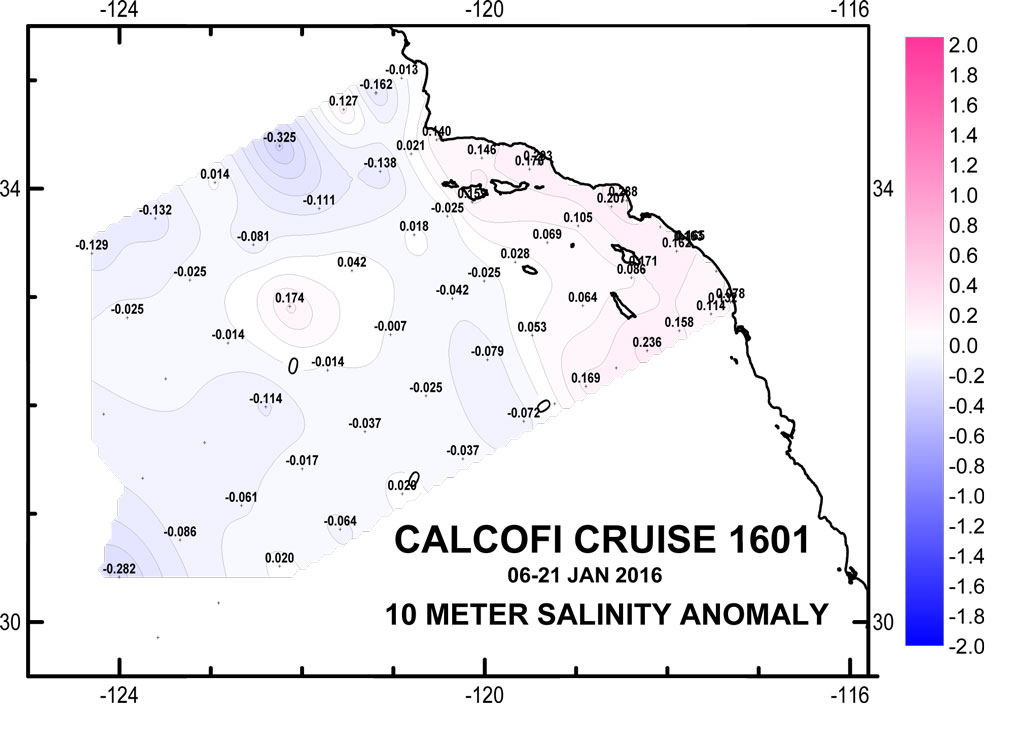
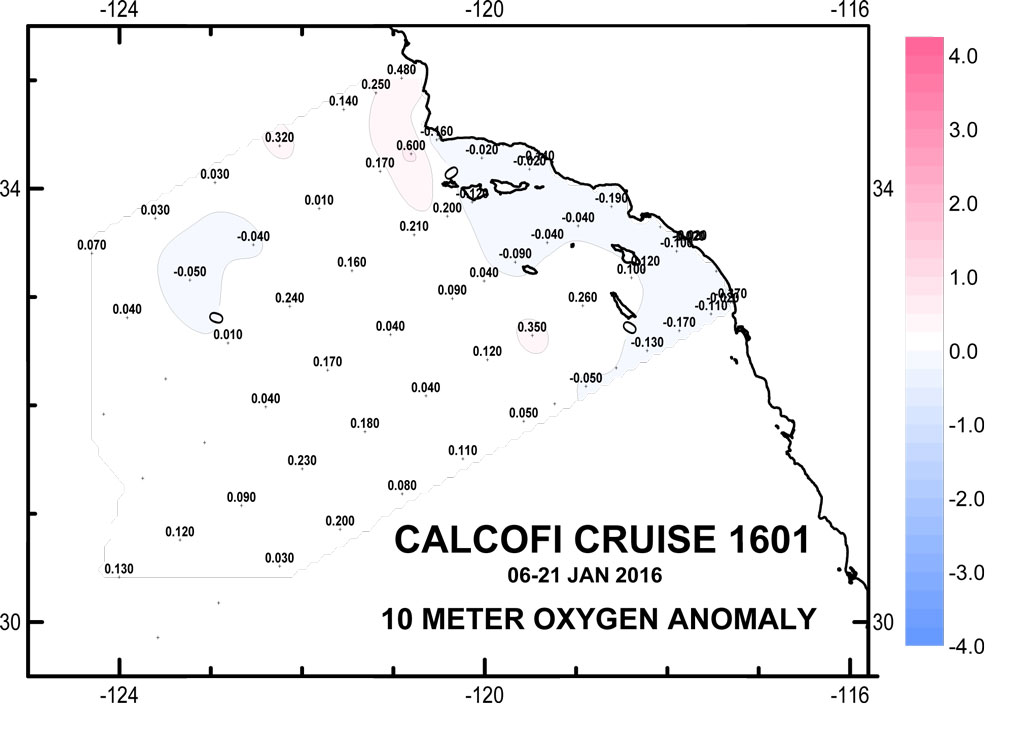
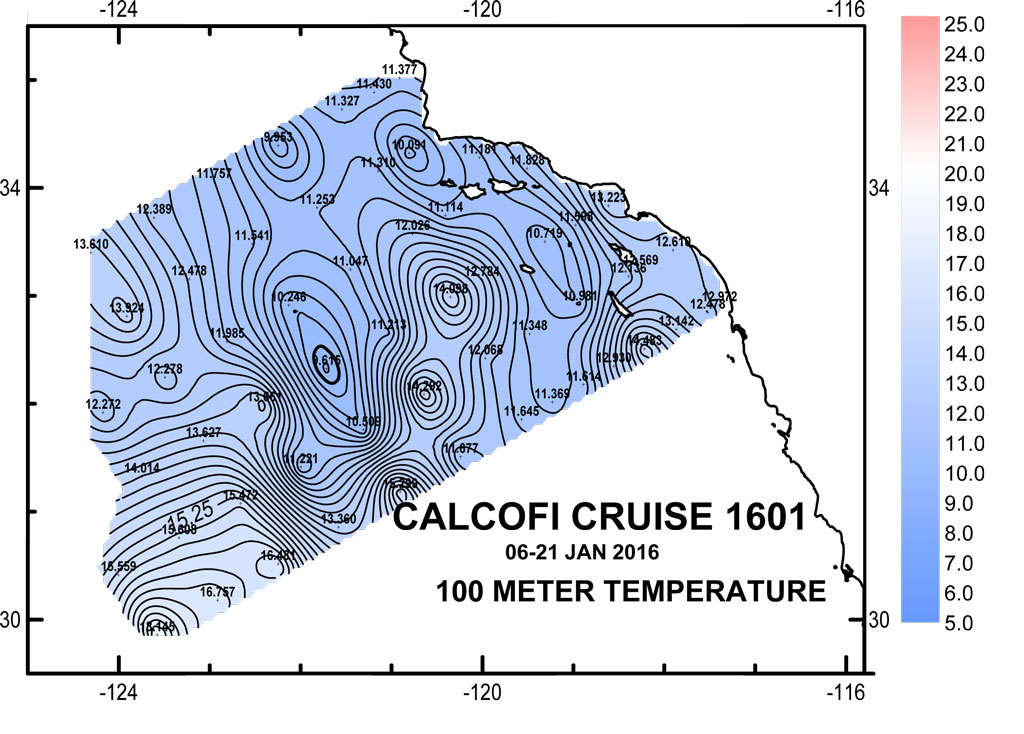
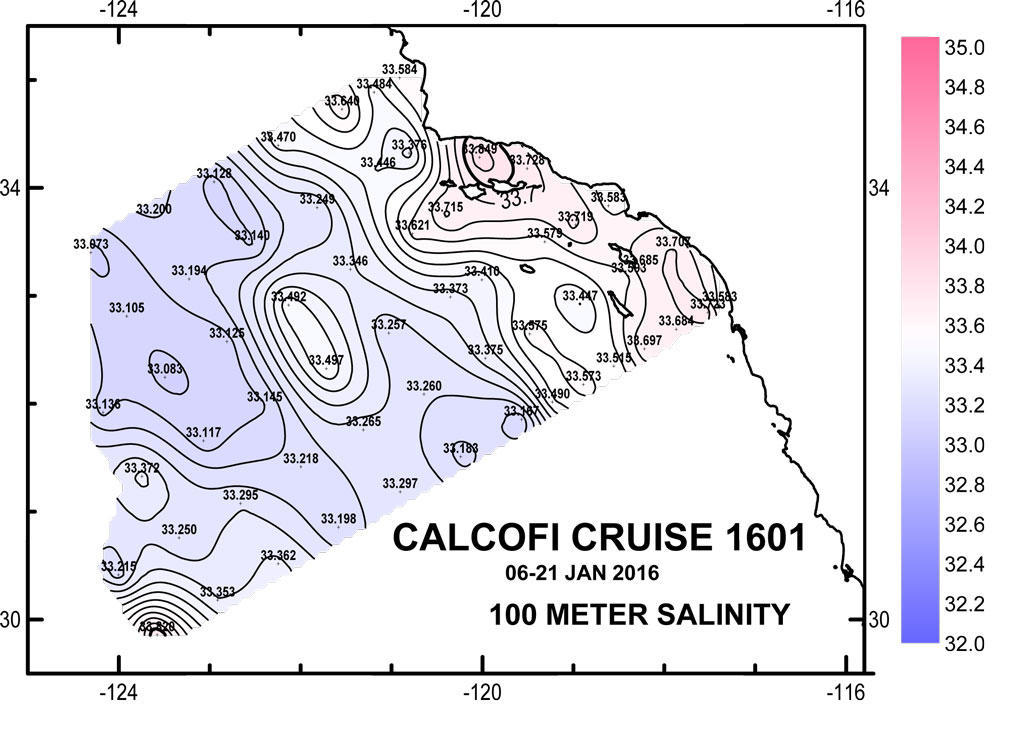
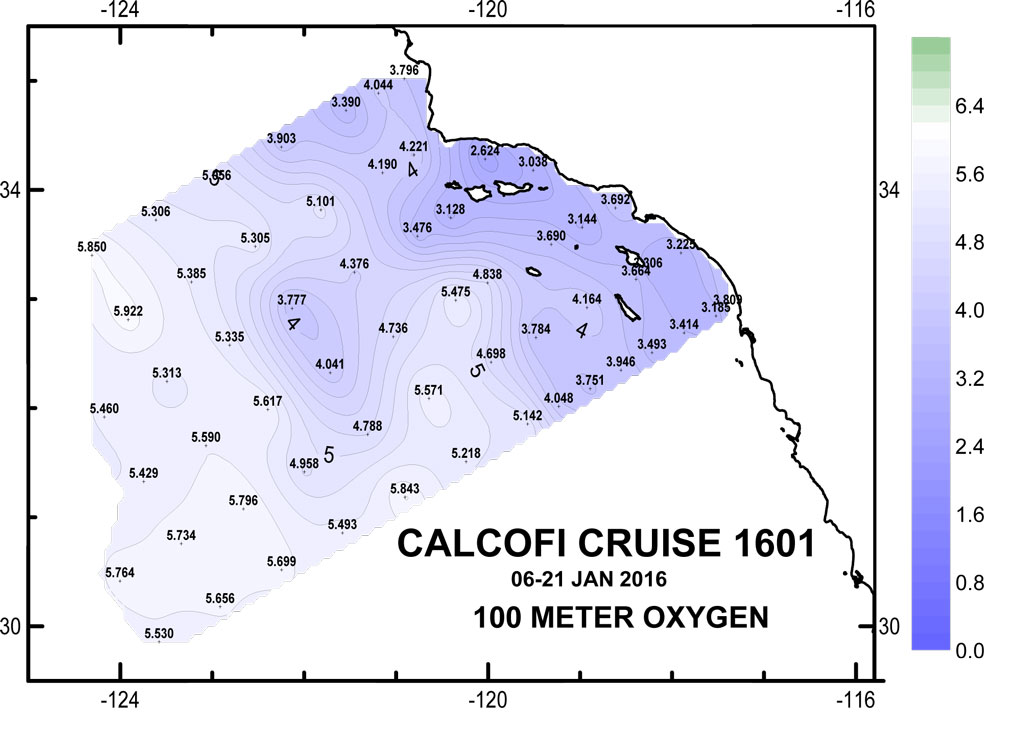
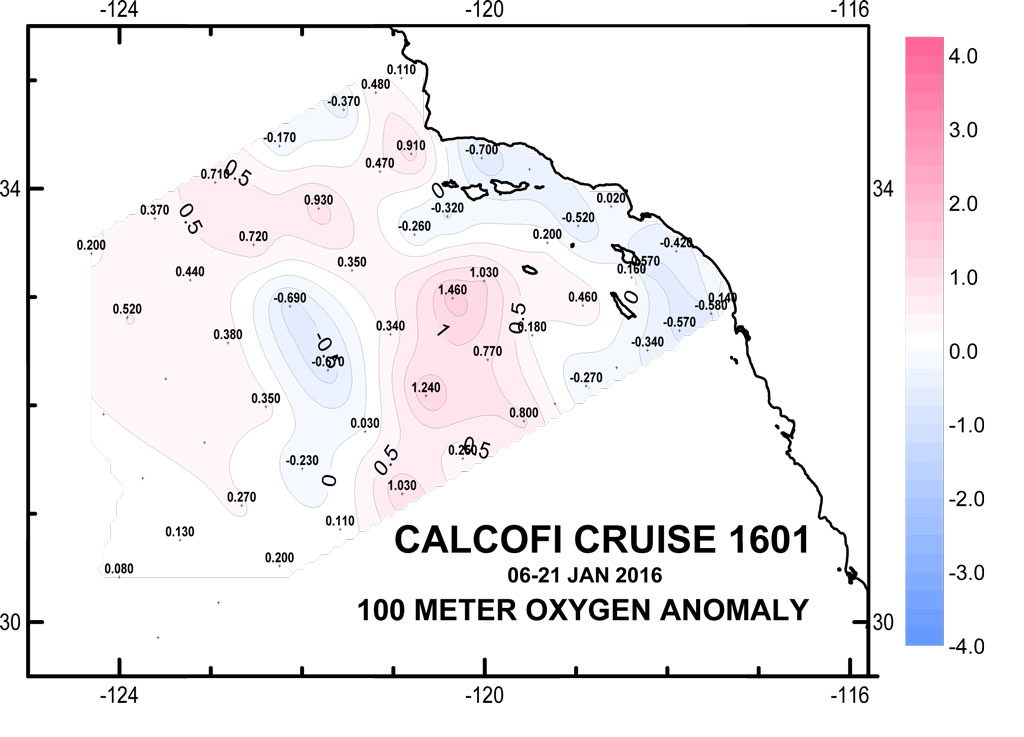
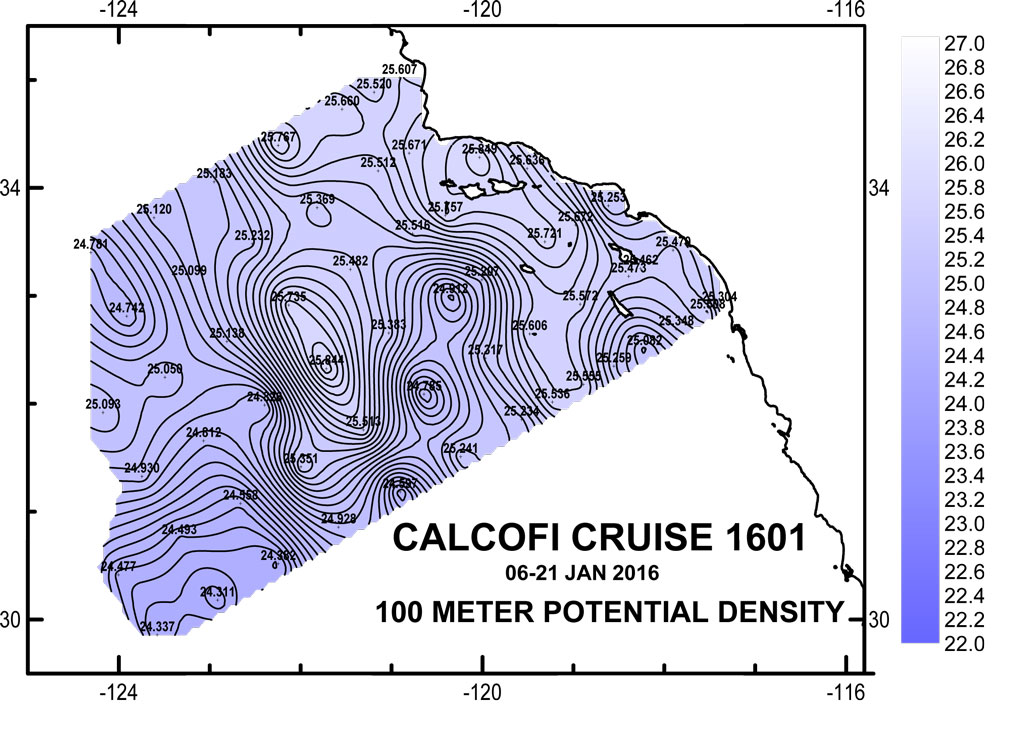
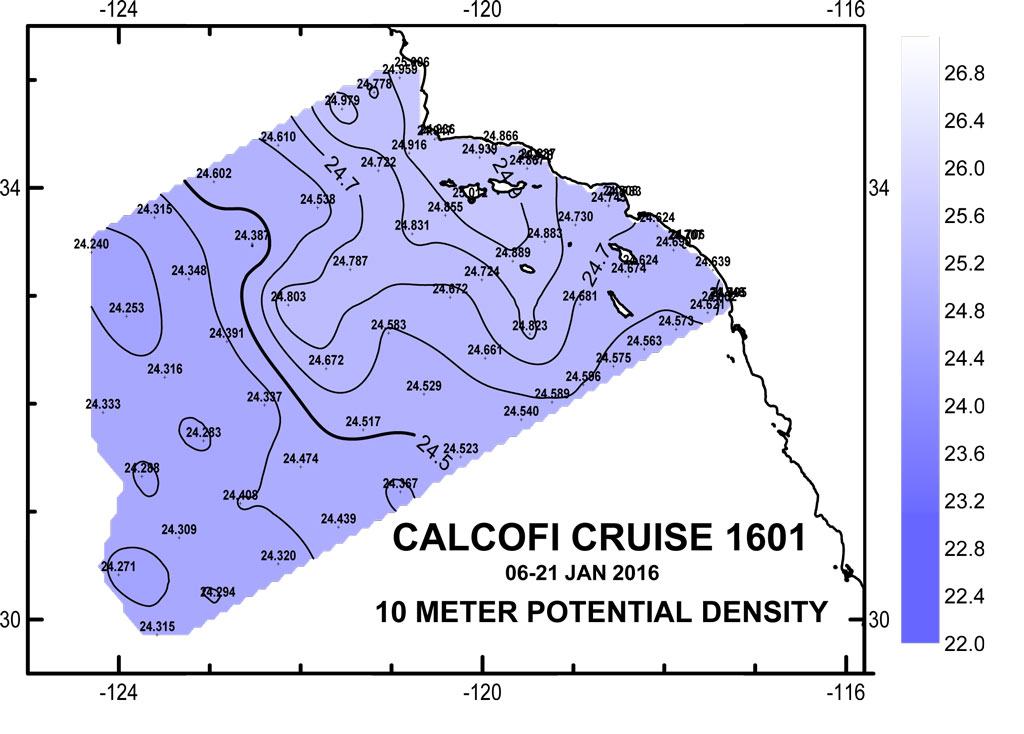
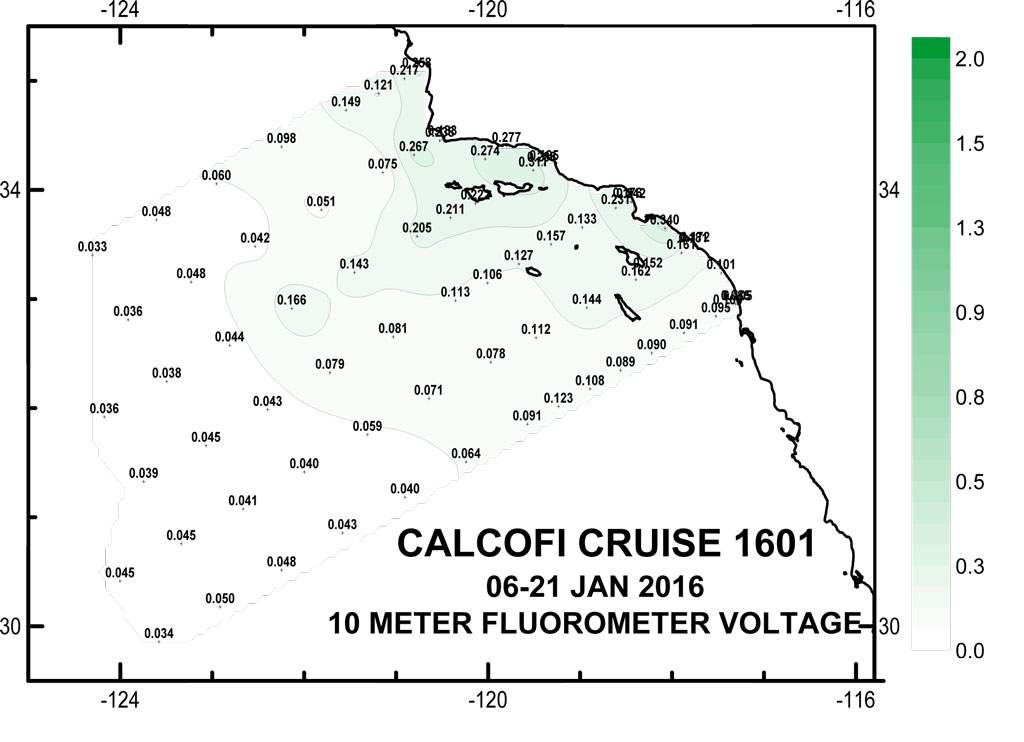
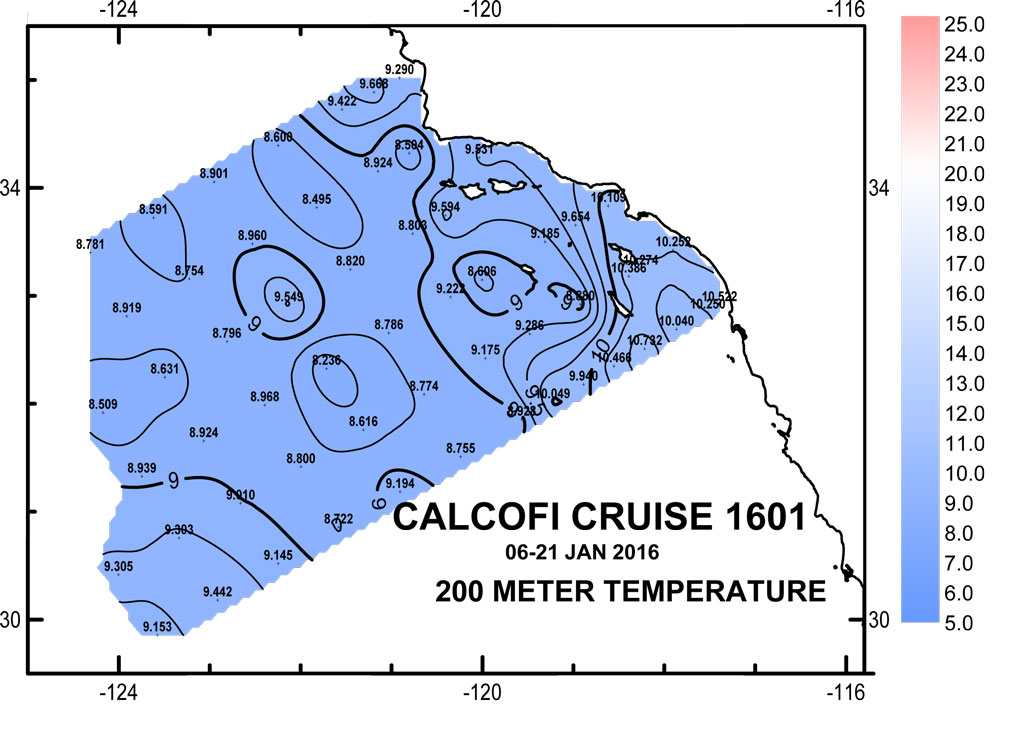
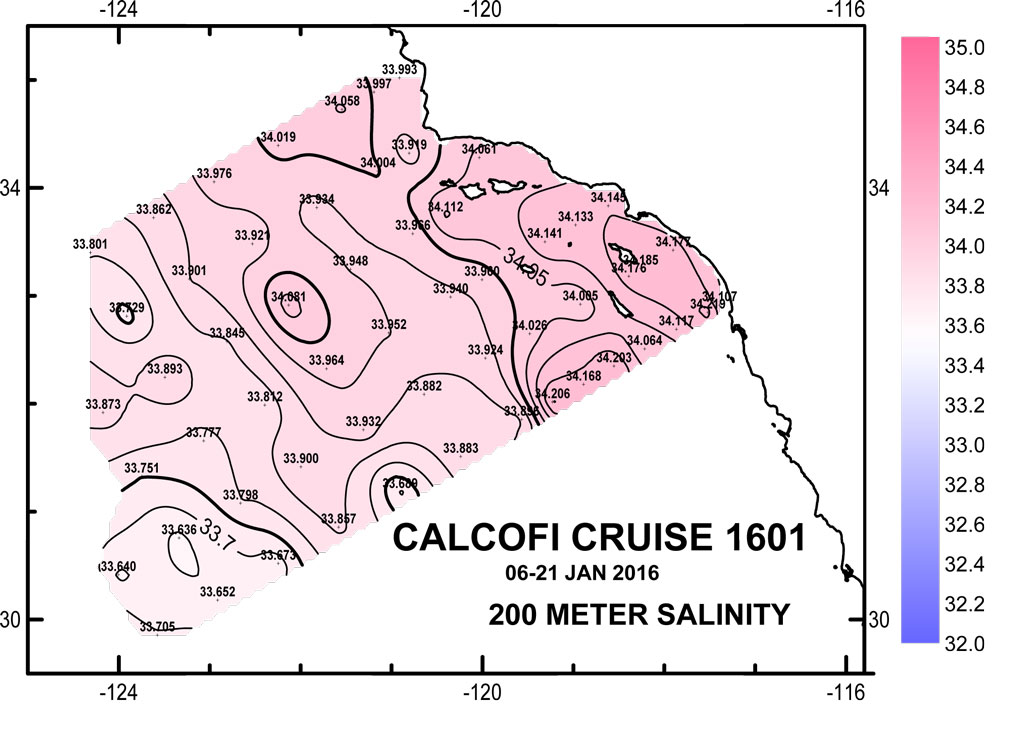
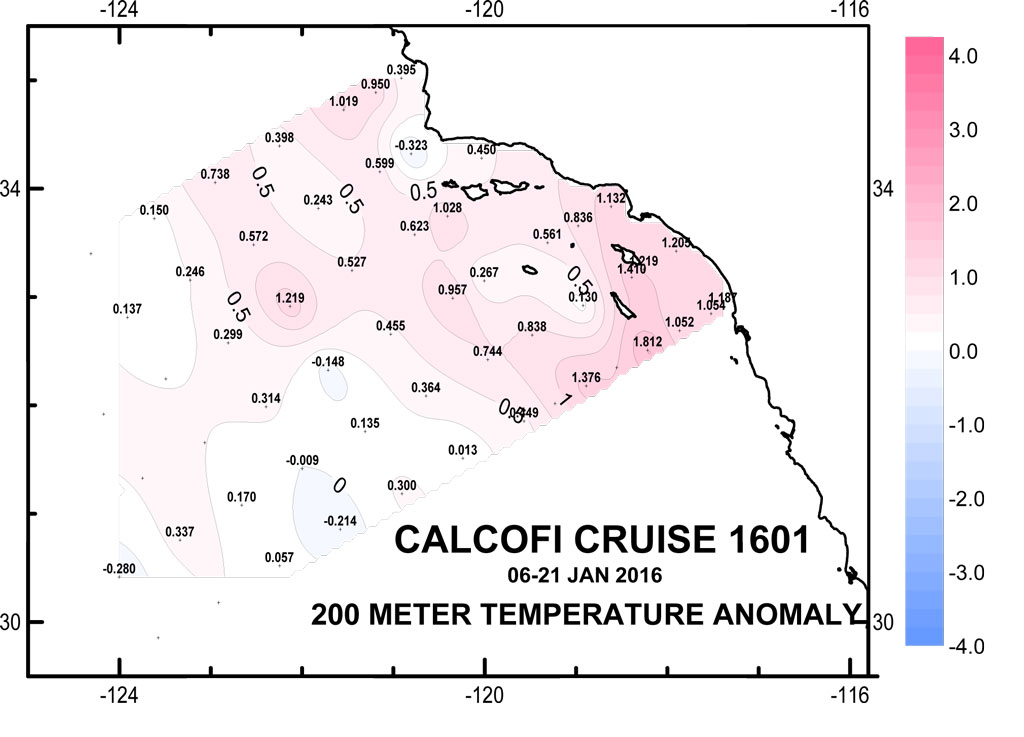
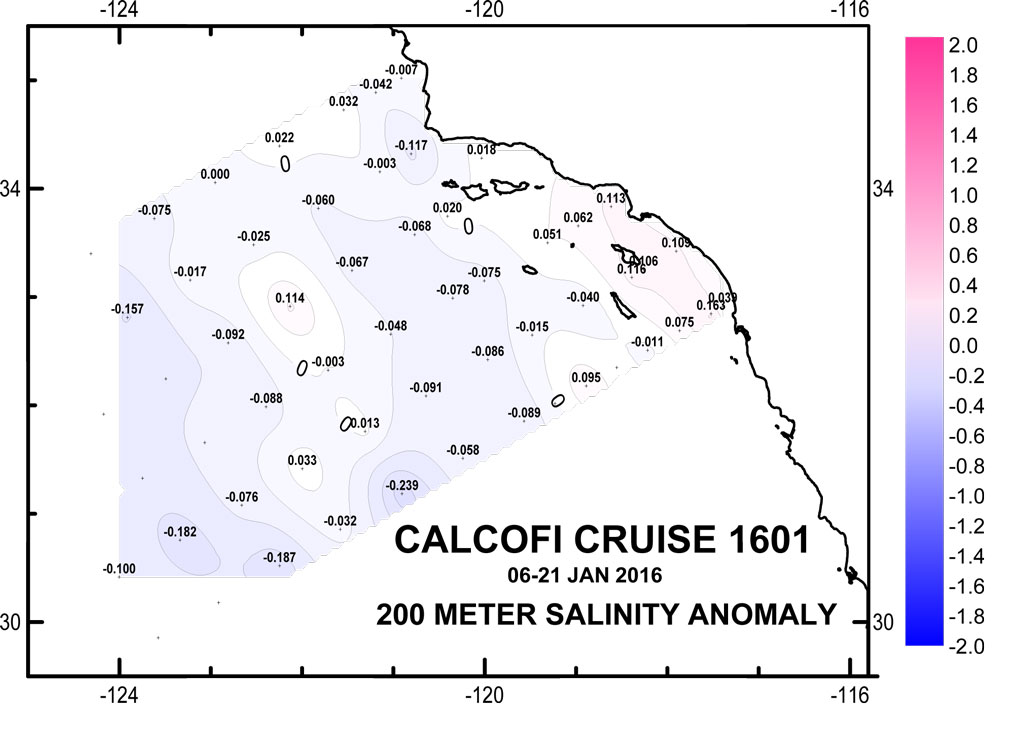
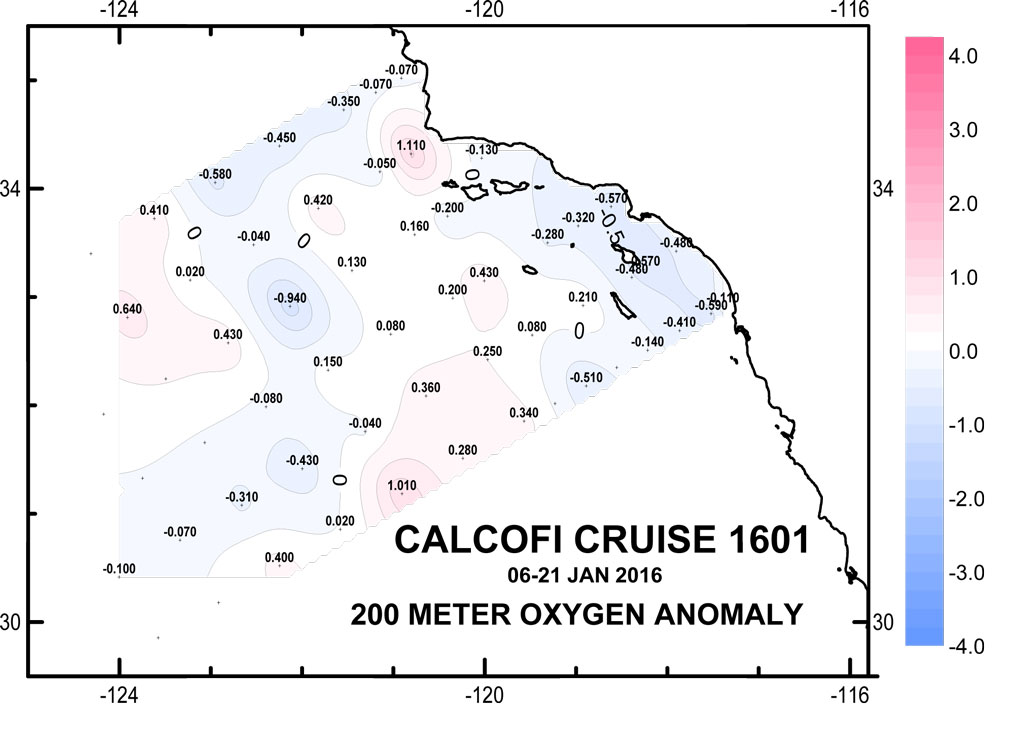
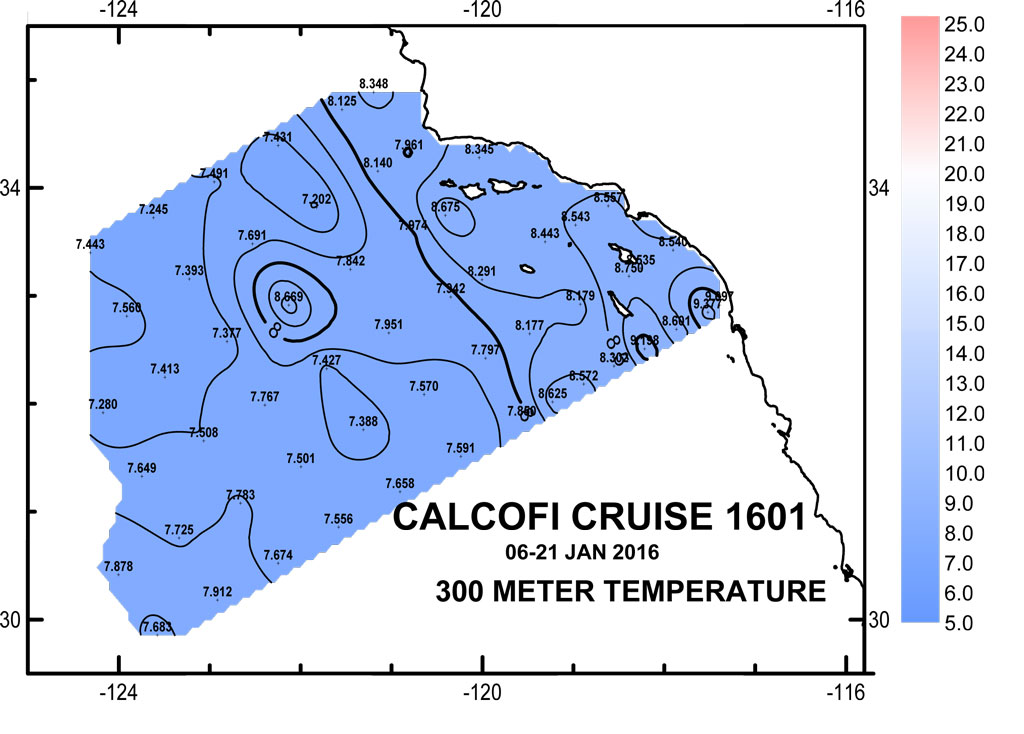
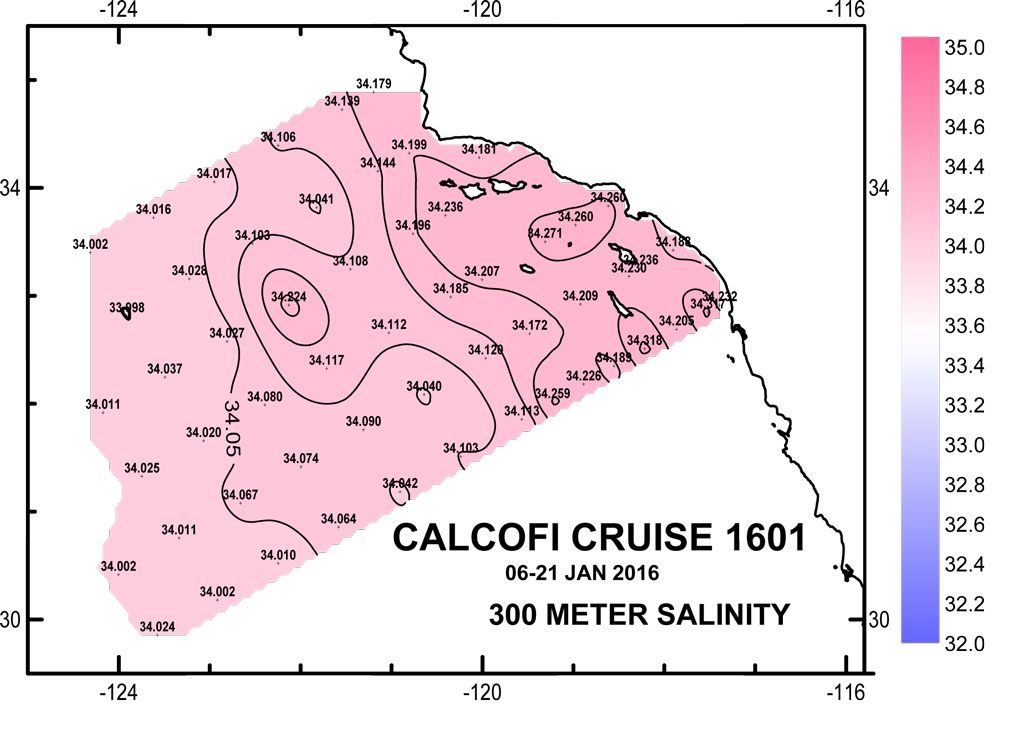
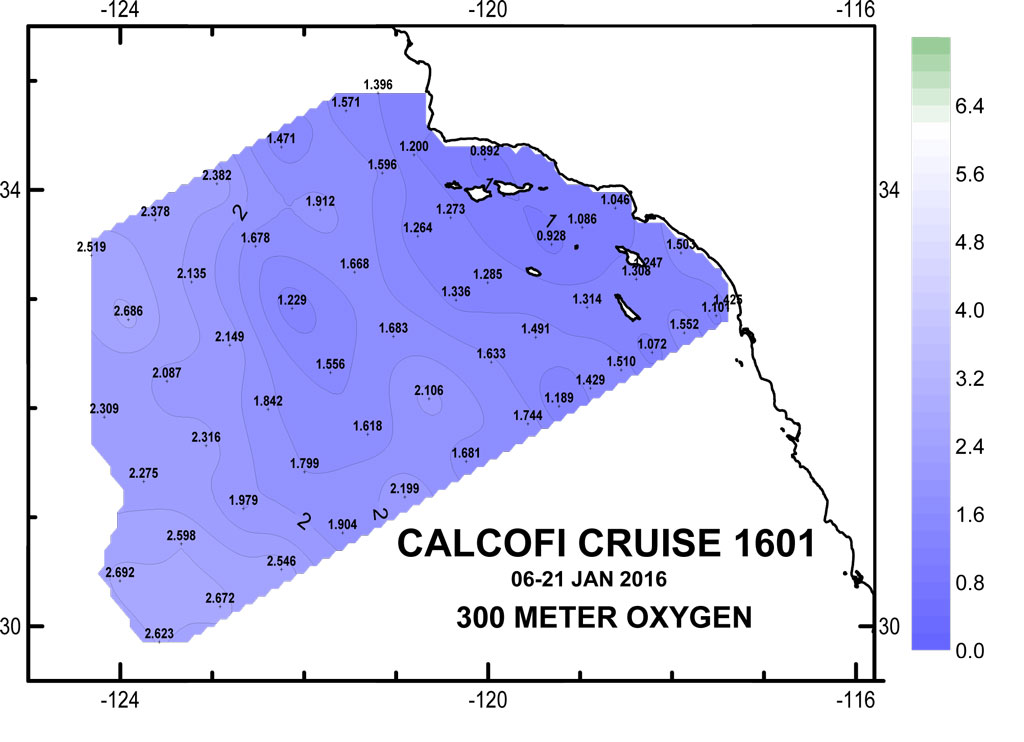
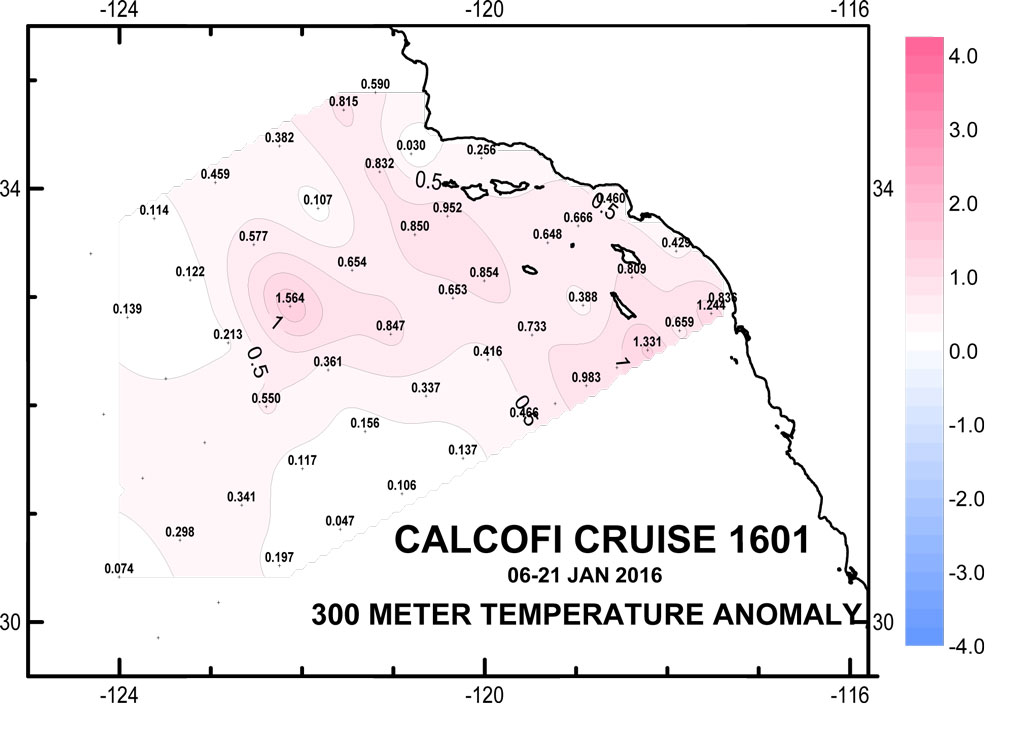
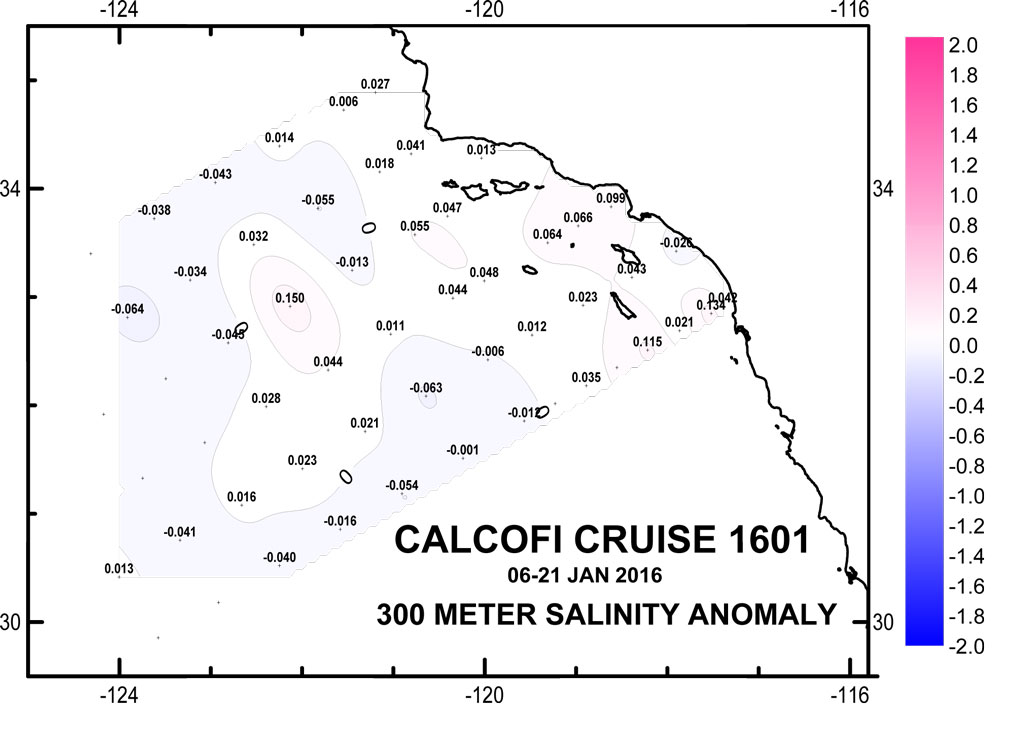
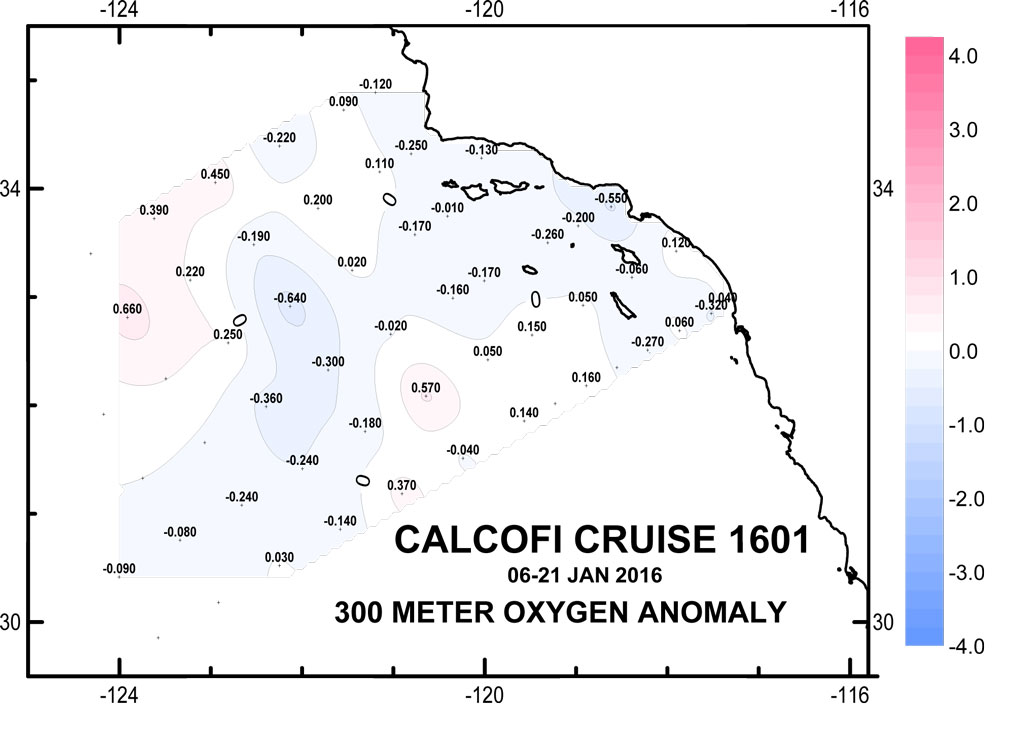
Please note that the anomalies are based on 50-year harmonics (1949-1999) and these data are 1m binavg Seasoft-processed CTD data that have not gone through thorough quality control checks or bottle corrections. They are presented to give a general impression of current conditions. Final data plots will be published after all data are processed.
| 10 & 100 meter Preliminary CTD Data & Anomaly (50yr mean) Contours (Click for larger image) | ||
 |
 |
 |
 |
 |
 |
 |
 |
 |
 |
 |
 |
 |
 |
 |
| 200 meters (Click for larger image) | ||
 |
 |
 |
 |
 |
 |
| 300 meter (Click for larger image) | ||
 |
 |
 |
 |
 |
 |
Platform: NOAA Ship Reuben Lasker
Project Number: RL-16-01 (OMAO), 1601RL (SWFSC)
Project Title: Winter CalCOFI, Fisheries Resources Division.
Project Dates: January 6, 2016 to January 30, 2016
Prepared: November 24 2105
Chief Scientist: David Griffith, SWFSC
Complete Cruise Instructions PDF pending
-
Brief Summary and Project Period
Survey the distributions and abundances of pelagic fish stocks, their prey, and their biotic and abiotic environments in the area of the California Current between San Francisco, California and San Diego, California during the period of January 6 to January 30, 2016. -
Days at Sea (DAS)
Of the 25 DAS scheduled for this project, 25 are funded by a Line Office Allocation. This project is estimated to exhibit a High Operational Tempo. -
Operating Area
The area covered during this survey will be from San Diego to San Francisco and extend approximately 200 miles offshore (please see appendices 1b & 2a in Cruise Instructions PDF). -
Summary of Objectives
Survey the distributions and abundances of pelagic fish stocks, their prey, and their biotic and abiotic environments in the area of the California Current between San Francisco, California and San Diego, California.
The following are specific objectives for the winter CalCOFI.- I.D.1. Continuously sample pelagic fish eggs using the Continuous Underway Fish Egg Sampler (CUFES). The data will be used to estimate the distributions and abundances of spawning hake, anchovy, mackerel, and early spawning Pacific sardine.
- I.D.2. Continuously sample multi-frequency acoustic backscatter using the Simrad EK60 and the Simrad ME70. The data will be used to estimate the distributions and abundances of coastal pelagic fishes (e.g., sardine, anchovy, and mackerel), and krill species.
- I.D.3. Continuously sample sea-surface temperature, salinity, and chlorophyll-a using a thermosalinometer and fluorometer. These data will be used to estimate the physical oceanographic habitats for target species.
- I.D.4. Continuously sample air temperature, barometric pressure, and wind speed and direction using an integrated weather station.
- I.D.5. Sample profiles of seawater temperature, salinity, chlorophyll-a, nutrients, and phytoplankton using a CTD with water-sampling rosette and other instruments at prescribed stations. Measurements of extracted chlorophyll and phaeophytin will be obtained with a fluorometer. Primary production will be measured as C14 uptake in a six hour in situ incubation. Nutrients will be measured with an auto-analyzer. These data will be used to estimate primary productivity and the biotic and abiotic habitats for target species.
- I.D.6. Sample the light intensity in the photic zone using a standard secchi disk once per day in conjunction with a daytime CTD station. These data will be used to interpret the measurements of primary production.
- I.D.7. Sample plankton using a CalBOBL (CalCOFI Bongo Oblique) at prescribed stations. These data will be used to estimate the distributions and abundances of ichthyoplankton and zooplankton species.
- I.D.8. Sample plankton using a Manta (neuston) net at prescribed stations. These data will be used to estimate the distributions and abundances of ichthyoplankton species.
- I.D.9. Sample the vertically integrated abundance of fish eggs using a Pairovet net at prescribed stations. These data will be used to quantify the abundances and distributions of fish eggs.
- I.D.10. Sample plankton using a PRPOOS (Planktonic Rate Processes in Oligotrophic Ocean Systems net) at all prescribed CalCOFI stations on lines 90.0 and 80.0 as well as stations out to and including station 70.0 on lines 86.7 and 83.3 and station 81.8 46.9. PRPOOS will not be towed on SCCOOS stations. These data will be used in analyses by the LTER (Long Term Ecological Research) project.
- I.D.11. Continuously sample profiles of currents using the RDI/Teledyne Acoustic Doppler Current Profiler. This will be dependent on the ability to sync the ADCP’s output with the EK60 and ME70. The EK60 and ME70 will hold priority over the ADCP.
- I.D.12. Continuously observe, during daylight hours, seabirds and mammals. These data will be used to estimate the distributions and abundances of seabirds and marine mammals.
-
Participating Institutions
- I.E.1 Southwest Fisheries Science Center (SWFSC)
- I.E.2 Scripps Institution of Oceanography (SIO)
- I.E.3 Farallon Institute Advanced Ecosystem Research (FIAER)
| CTD Processing Summary CalCOFI 1601RL CTD Final Data - 14Mar2017 | |||
| Download 1601RL CTD raw cast files zipped (rev 22Mar2017) | Download 1601 FinalQC CTD + bottle data (22Mar2017 revision) | ||
|
General CTD Notes - data acquisition notes, logistics, processing - see below. Final data include the 10May2016 reprocessed secondary CTD oxygens; 22Mar2017 reprocessed cast 099 |
|||
| CTD sensor corrections derived by comparing CTD sensor data, 4sec average prior to bottle closure, to bottle samples | |||
| Dual T, S, & O2 | Primary Sensor | Secondary Sensor | |
| Salinity offset (bottle - CTD salinity; > 350m only; Seabird SBE4) | -0.0007 | 0.002354 | |
| Oxygen ml/L (dual Seabird SBE43; 2° O2 Calib Off) | y = 1.0361x - 0.0043 R² = 0.9999 |
y = 1.0716x - 0.0235 R² = 0.9996 |
|
| Oxygen umol/Kg (dual Seabird SBE43; 2° O2 Calib Off) | y = 1.0376x - 0.0851 R² = 0.9999 |
y = 1.0731x - 0.9237 R² = 0.9996 |
|
| Single sensors | Linear | Polynomial | |
| Nitrate - ISUS 4sec ave voltage vs Bottle Nitrate (Satlantic MBARI-ISUS v2) | y = 29.475x - 2.8237 R² = 0.9922 |
||
| Fluorometer - linear & polynomial regressions |
y = 7.9516x - 0.2637 R² = 0.9160 |
y = 6.1733x2+6.3849x-0.1981 R² = 0.9205 |
|
 |
 |
||
 |
 |
||
 |
 |
||