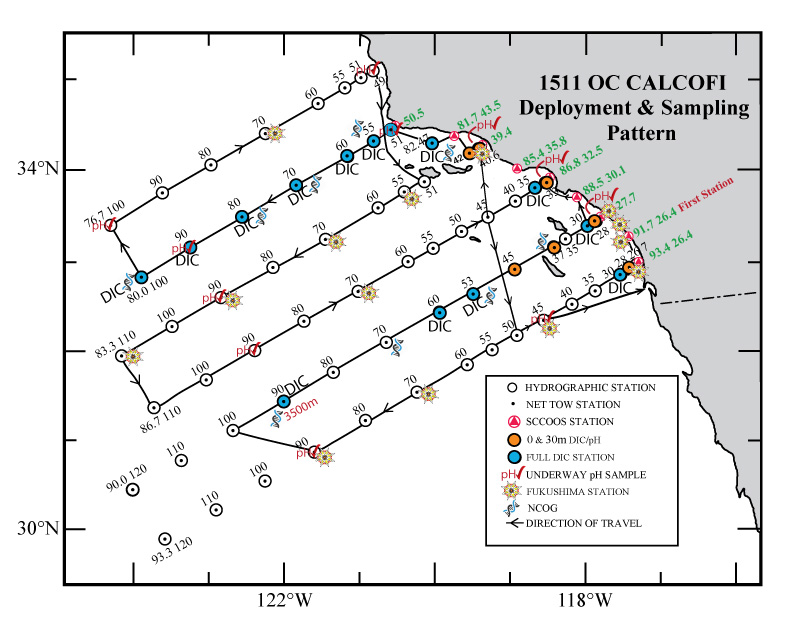
| Summary: | 1511OC Fall CalCOFI cruise on RV Oceanus; 28 Oct - 13 Nov 2015; 68 stations (61 standard & 7 SCCOOS) successfully occupied. Five stations on the first two southern lines - stations 93.3 100, 110, 120 & stations 90.0 110, 120 - were cancelled due to bad weather. Station 93.3 50 was initially missed due to bad weather but occupied during the transit home, as station #69. Net tows on stations 86.7 45 & 93.3 45 were initially missed due to high winds but performed during the southward transit home. Second CTD casts, without seawater sample collection, were performed on these two net tow stations. Because the seas were consistently rough, the stations were reordered to allow work to continue. Please refer to the final track map below for the order occupied. Although visually confusing, the track northward from 86.7 45.0 was after its occupation as station #31. Station 86.7 45.0 was re-occupied during the southward transits as station #68 to recover missed net tows. |
| Data Files: | 1511OC CTD FinalQC CTD+Bottle files; 1511OC CTD (raw) Cast files;1511OC Preliminary Plots; |
| Cruise Designation: | CalCOFI 1511OC; OSU OC1510B |
| Load Dates: | Newport OR: 23 - 24 Oct 2015 (Fri-Sat): Map |
| Cruise Dates: | 25 Oct - 13 Nov 2015 (Sun - Fri) |
| Offload Date: | 13 Nov 2015 (day-of-return; Fri) at 10th Ave Marine Terminal, San Diego CA |
| Ship: | OSU RV Oceanus |
| Communication: | Cellular: 541-207-598; IRIDIUM: 011-881-641-413-524; VHF-FM Channels 13 & 16, call sign WXAQ |
| Station plan: | 75 Standard (66 CalCOFI + 9 SCCOOS); Project Instructions (PDF); please note the alternate station pattern on lines 83 & 80 |
| Deck/Lab plans: | Tentative 2-van main deck & lab layouts |
| Cruise Forms: | OSU Cruise Participants Form PDF; Cruise Planning Manual web page |
| Cruise Map: | |
 |
|
| Contacts: | Dave Wolgast, Chief Scientist, IOD SIO-CalCOFI |
| Amy Hays, SWFSC-NOAA Technical Coordinator | |
| Jennifer Rodgers-Wolgast, IOD SIO-CalCOFI Volunteer Coordinator | |
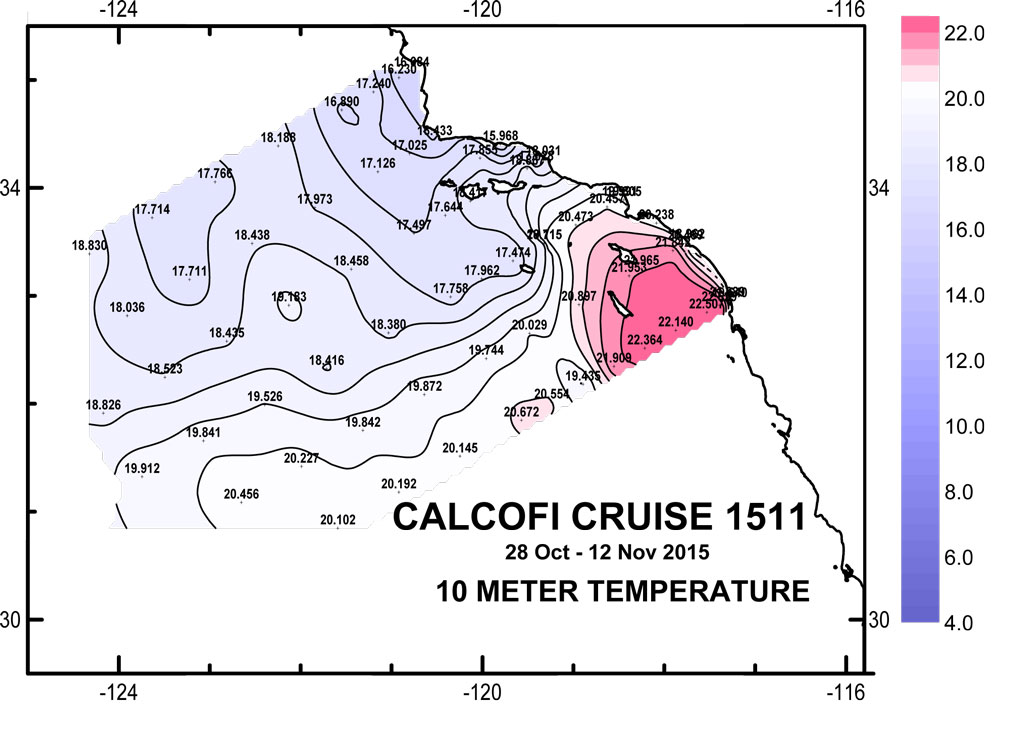
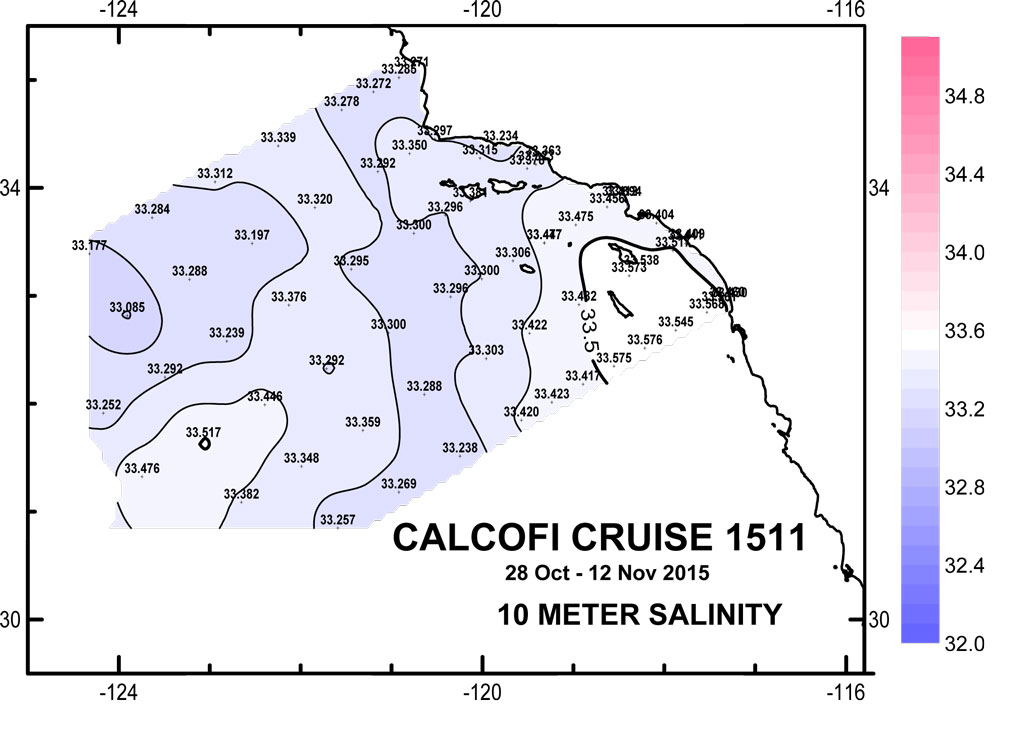
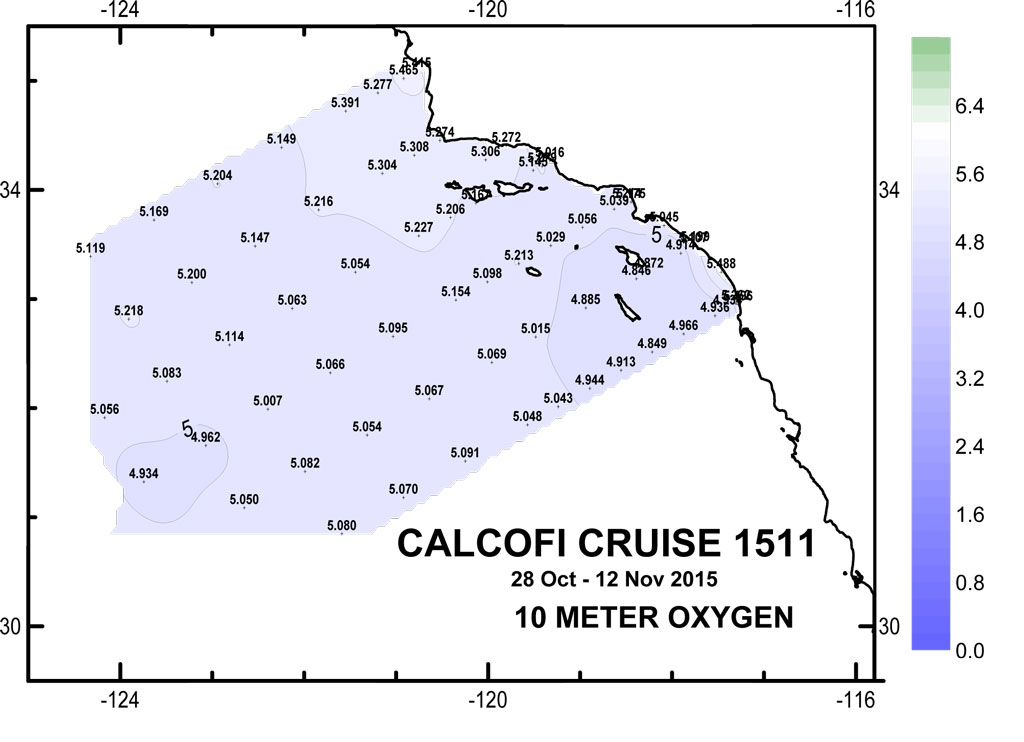
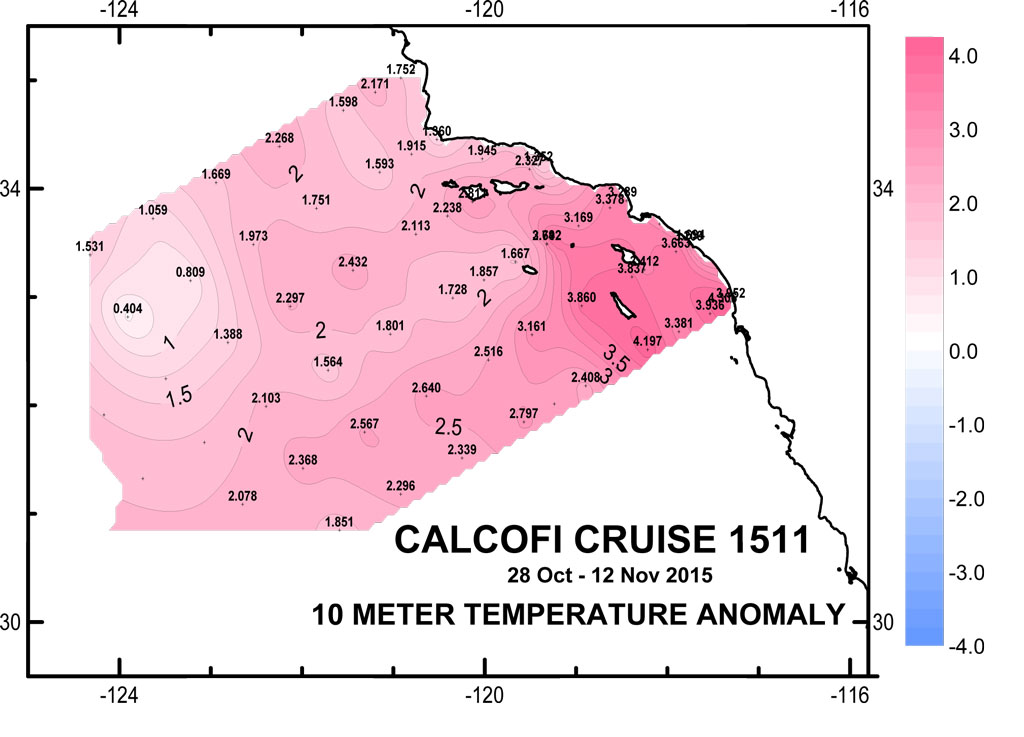
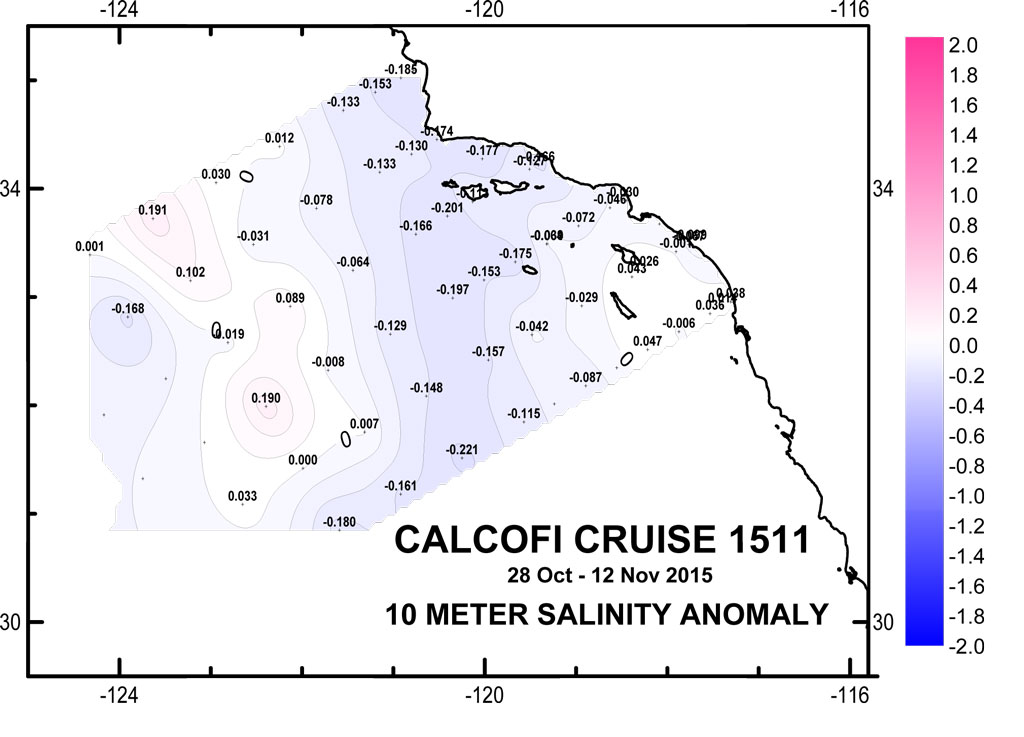
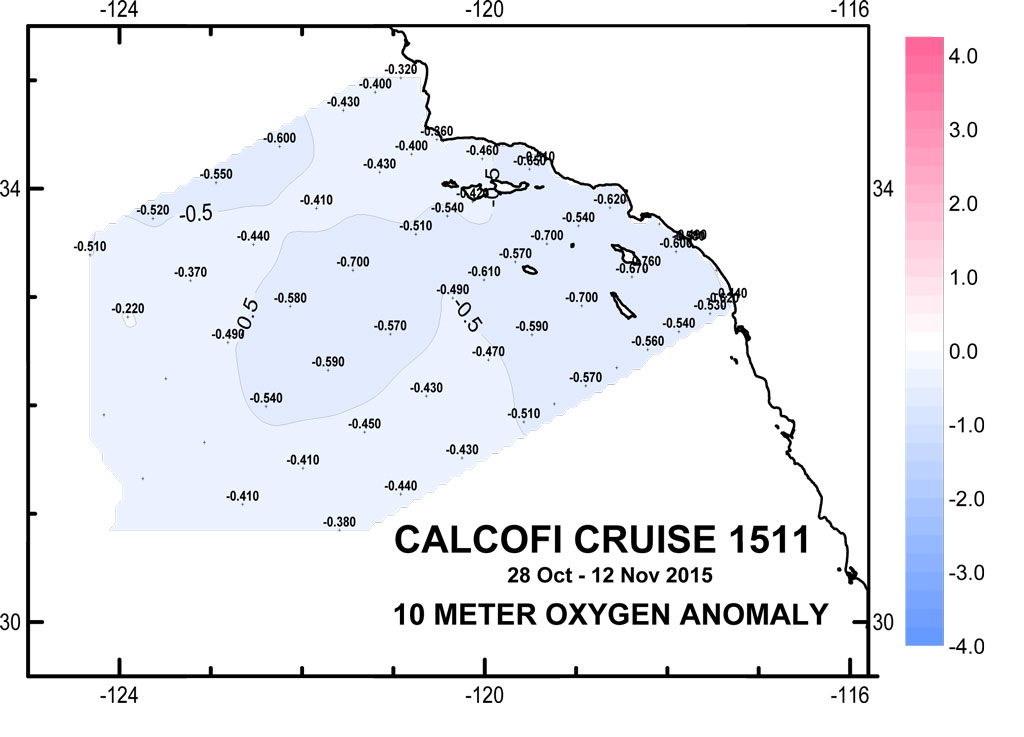
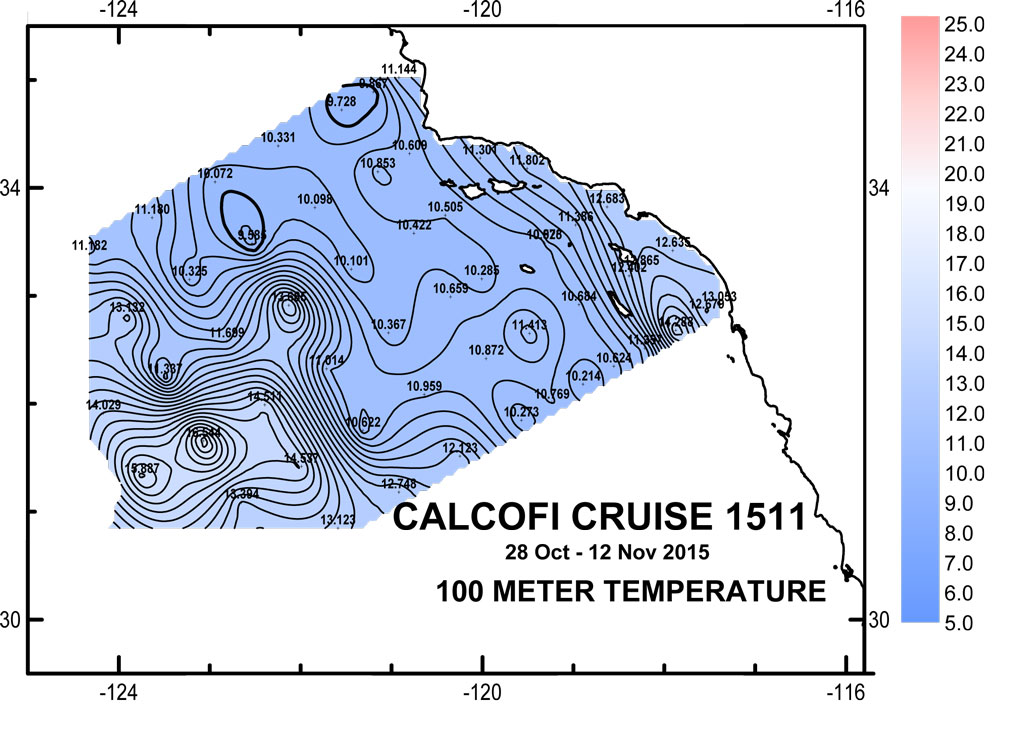
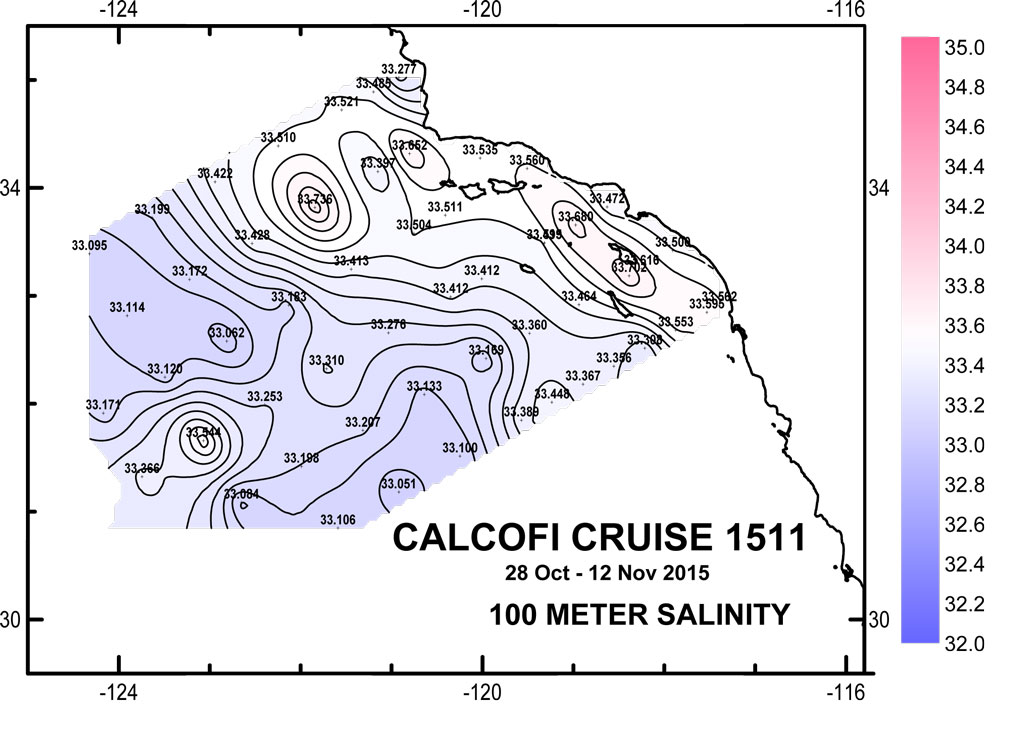
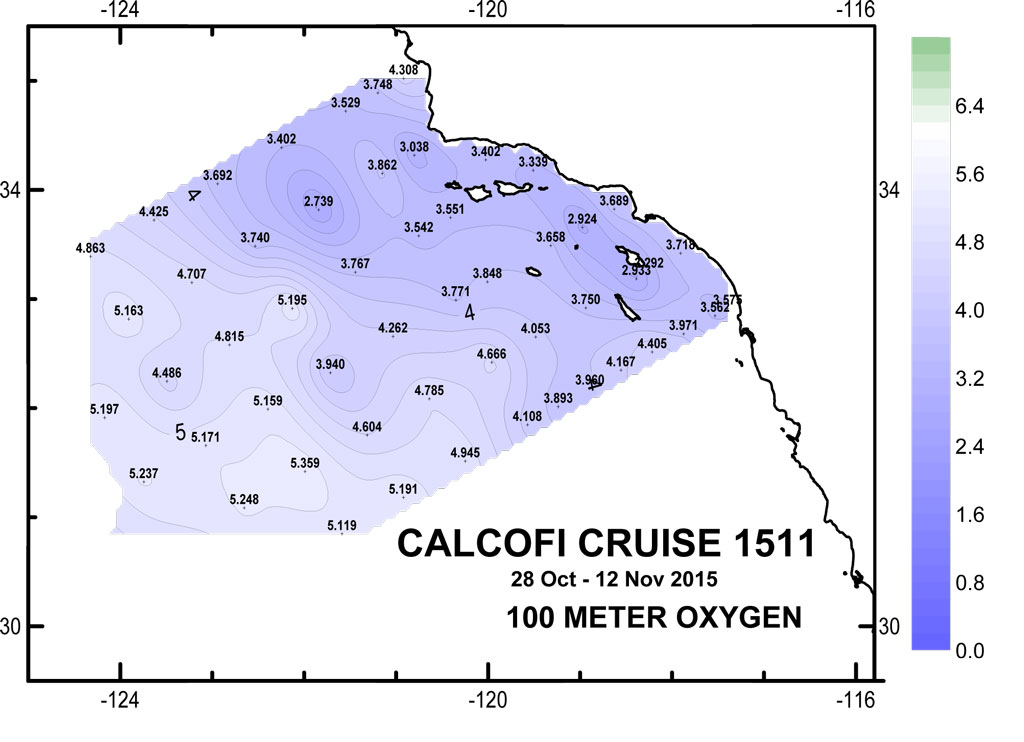
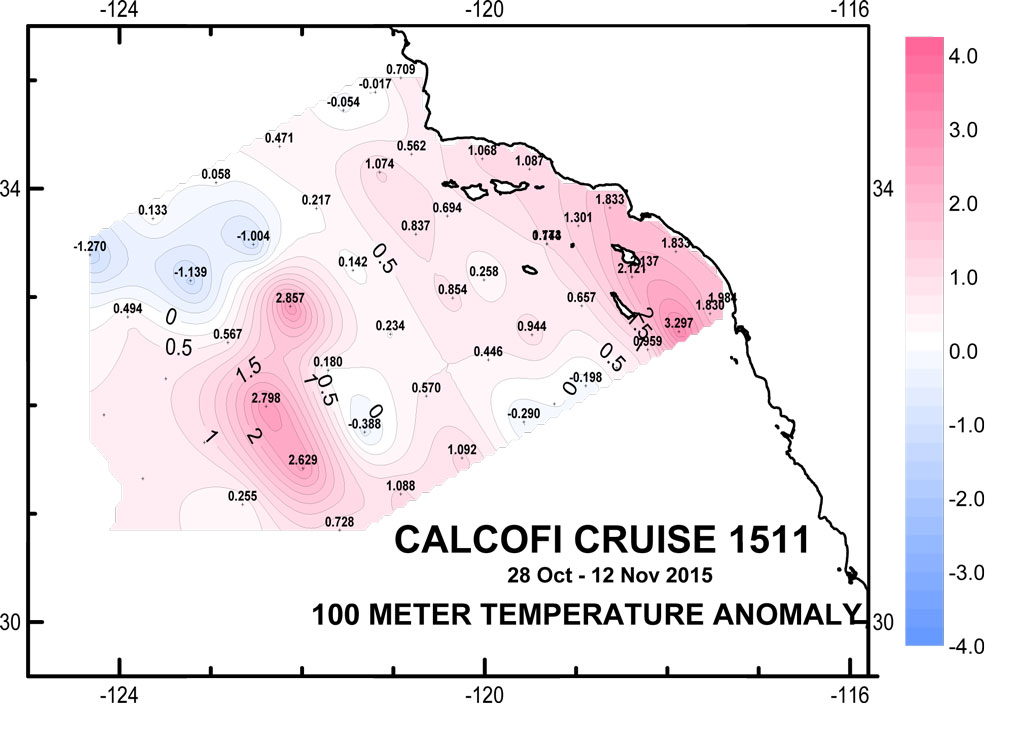
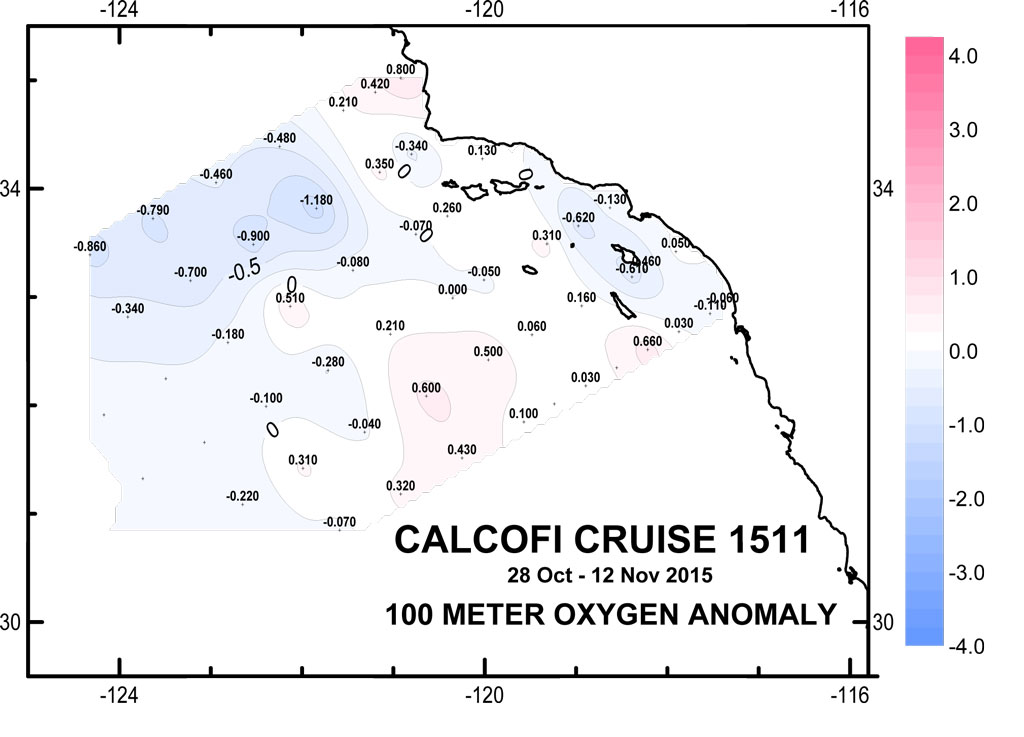
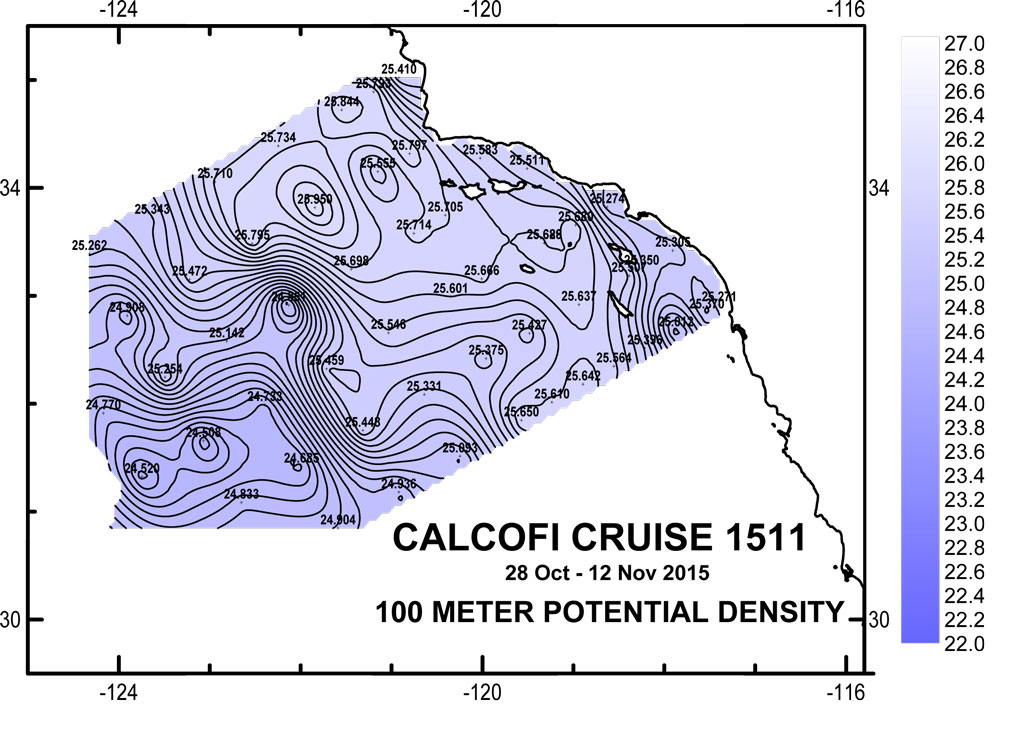
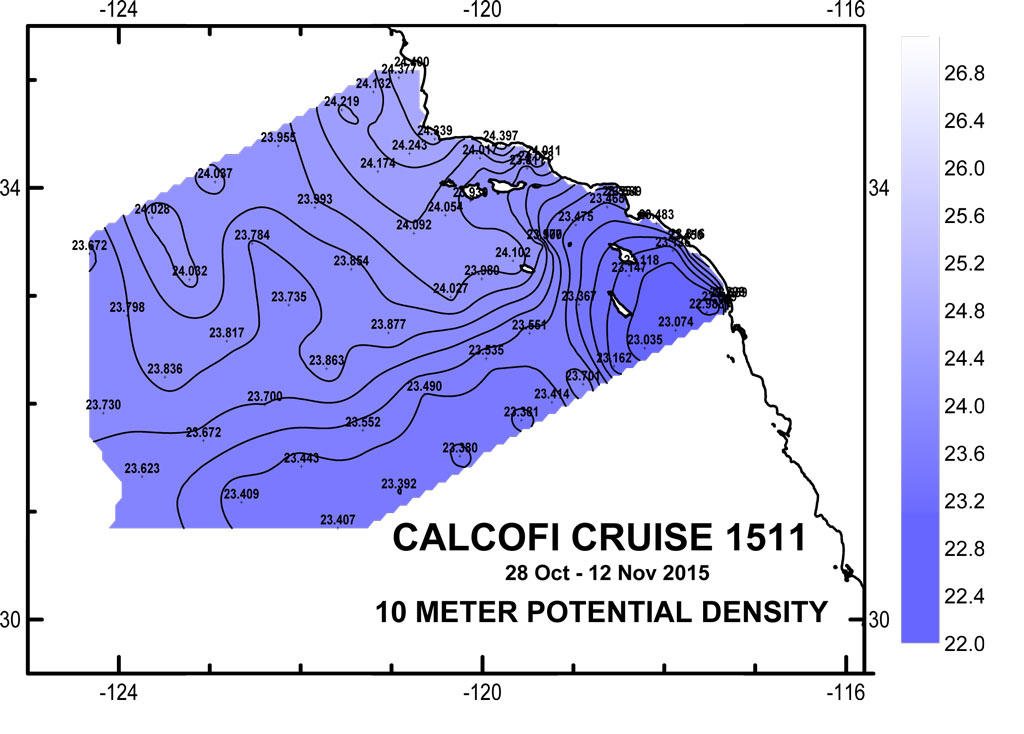
Please note that the anomalies are based on 50 year harmonics (1949-1999) and these data are 1m binavg Seasoft-processed CTD data that have not gone through thorough quality control checks or bottle corrections. They are presented to give a general impression of current conditions. Final data plots will be published after all data are processed.
| 10 & 100 meter Preliminary CTD Data & Anomaly (50yr mean) Contours (Click for larger image) | ||
 |
 |
 |
 |
 |
 |
 |
 |
 |
 |
 |
 |
 |
 |
 |
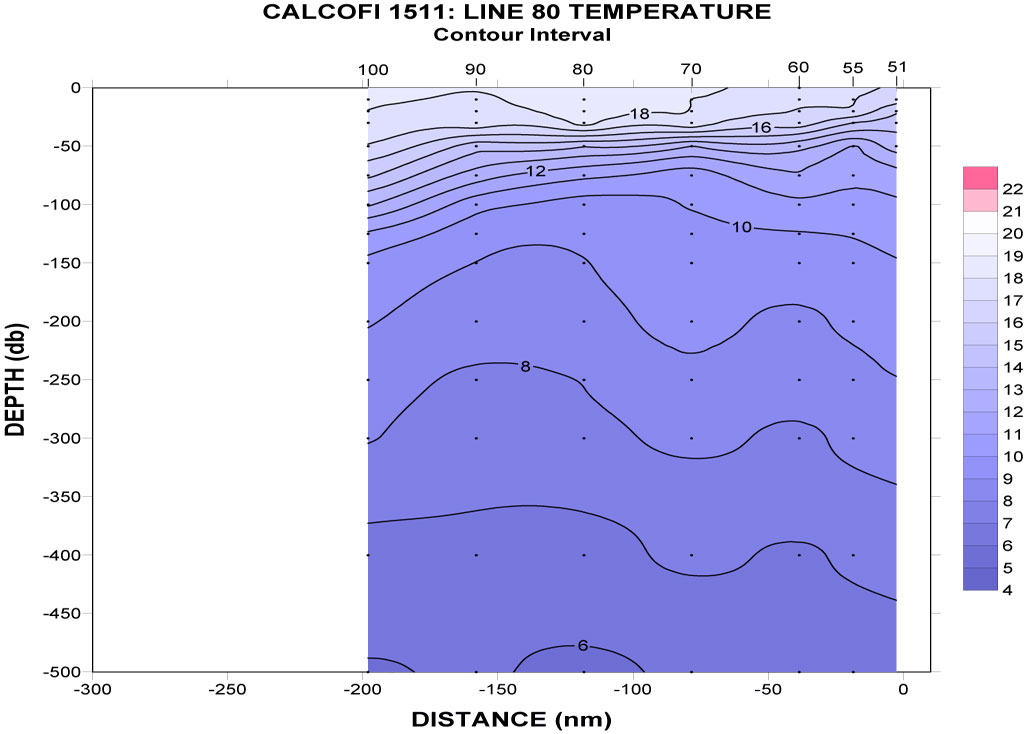
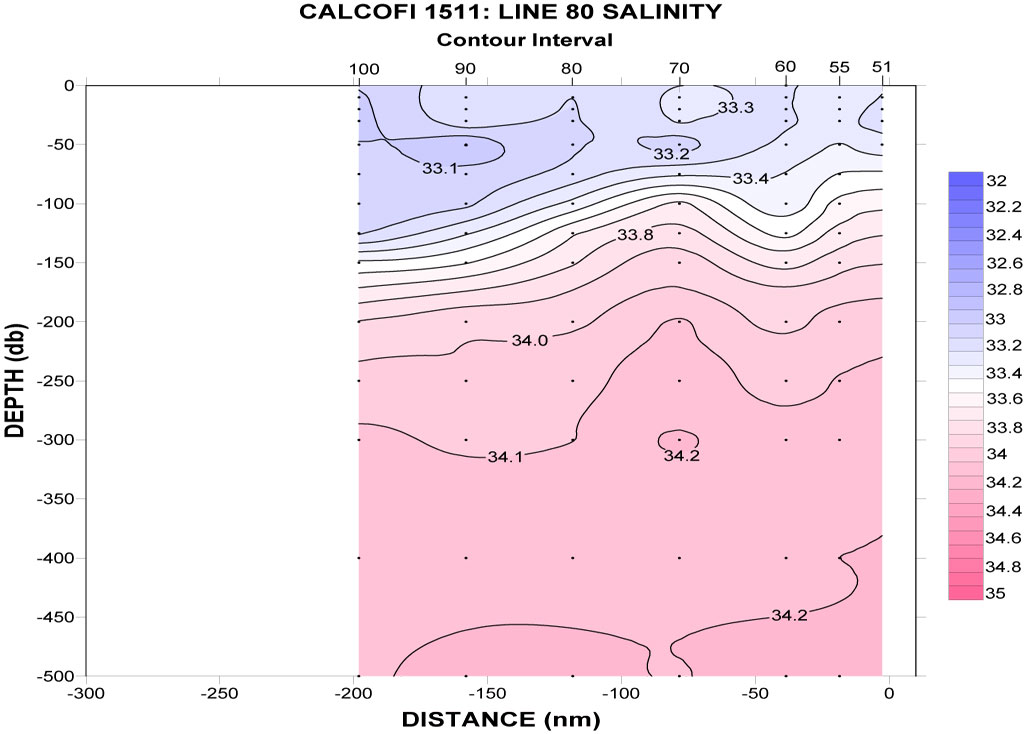
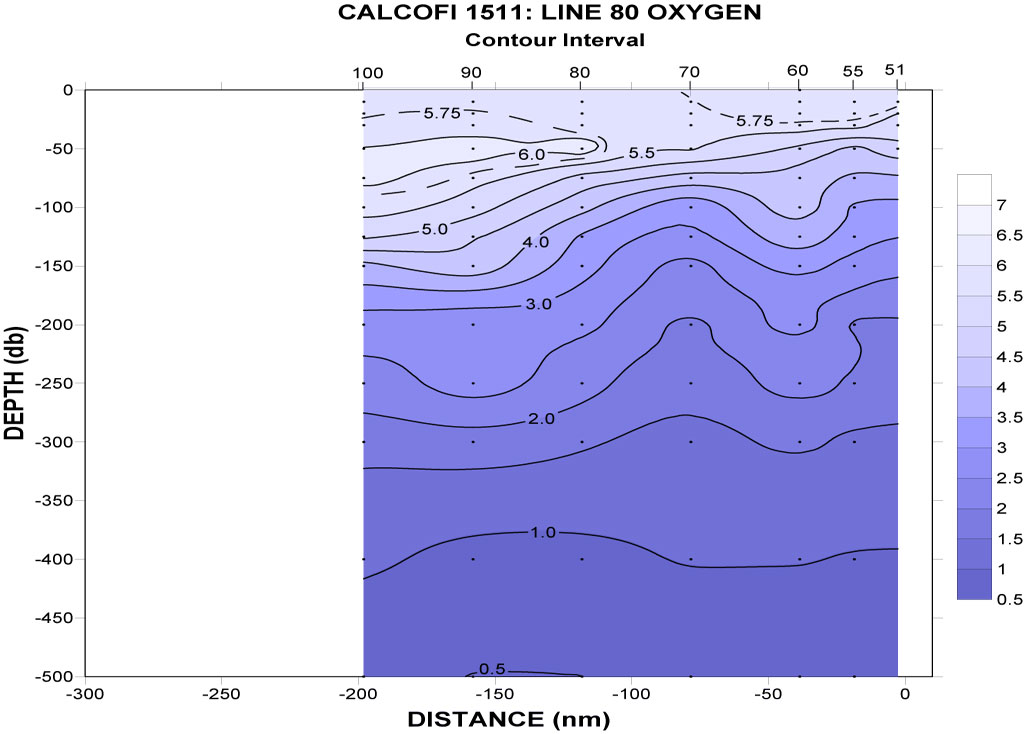
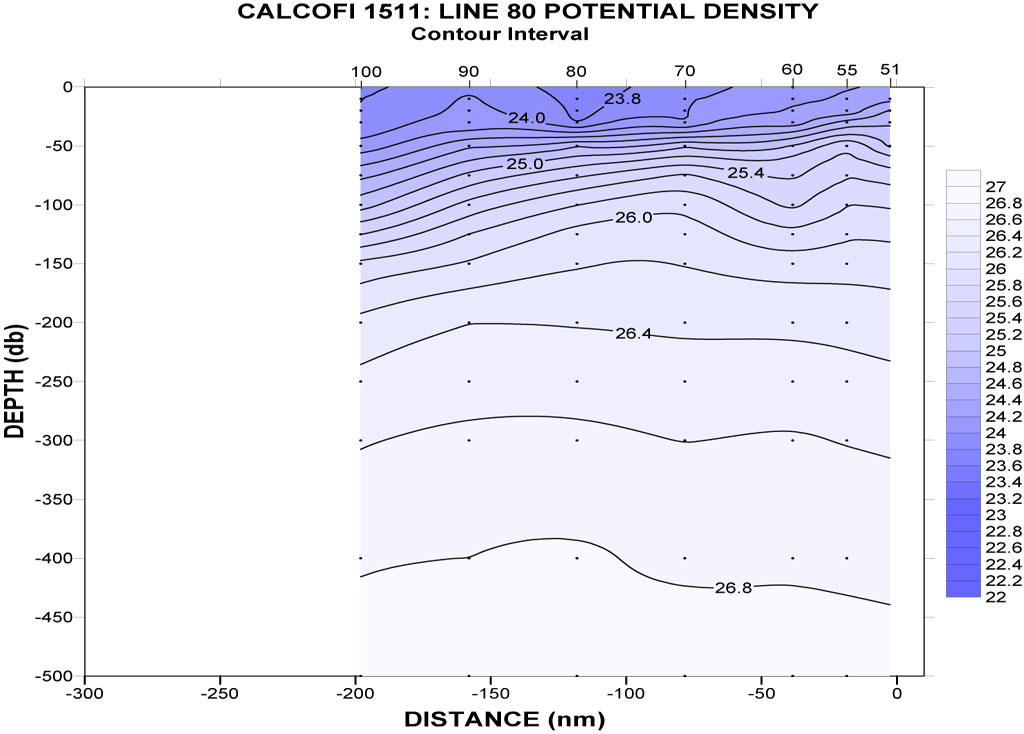
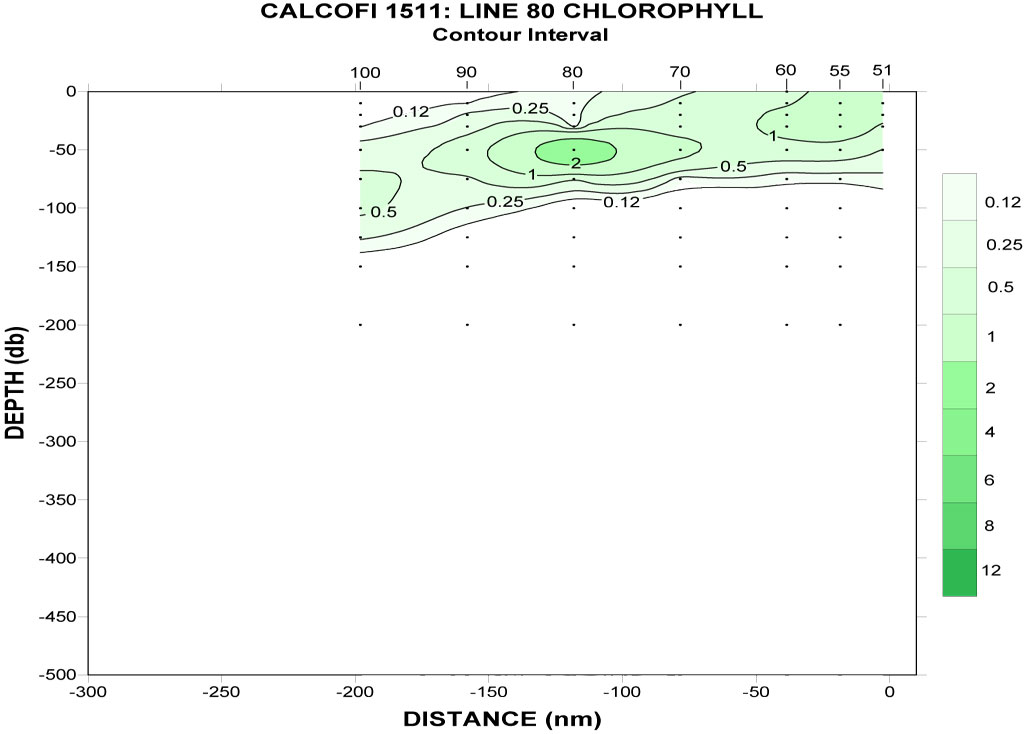
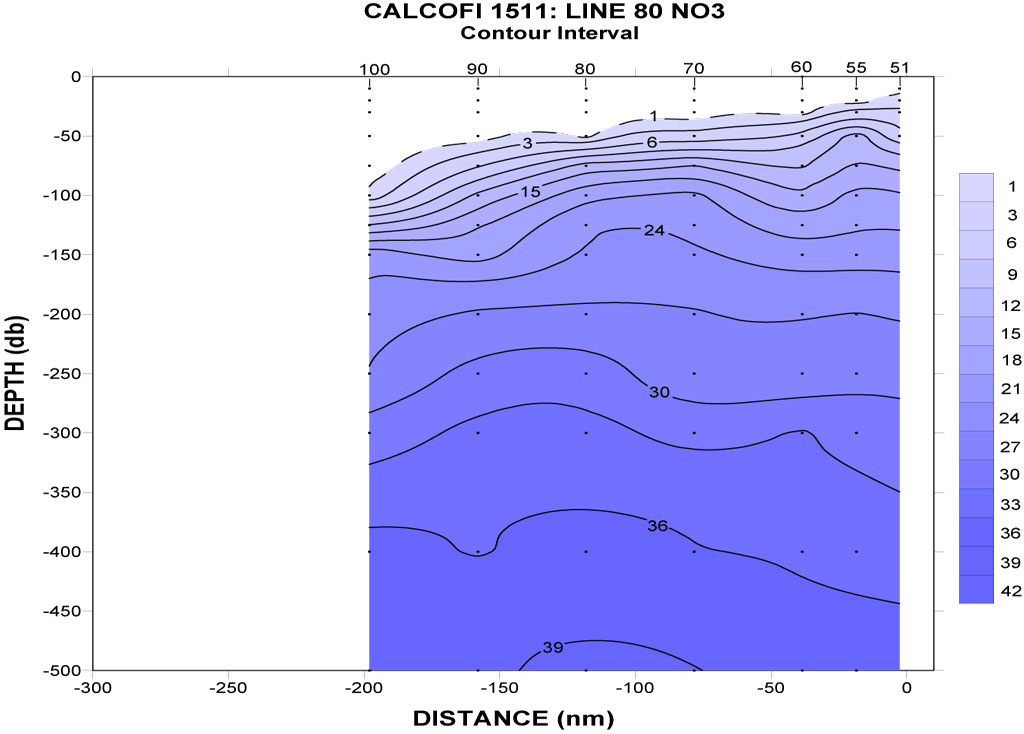
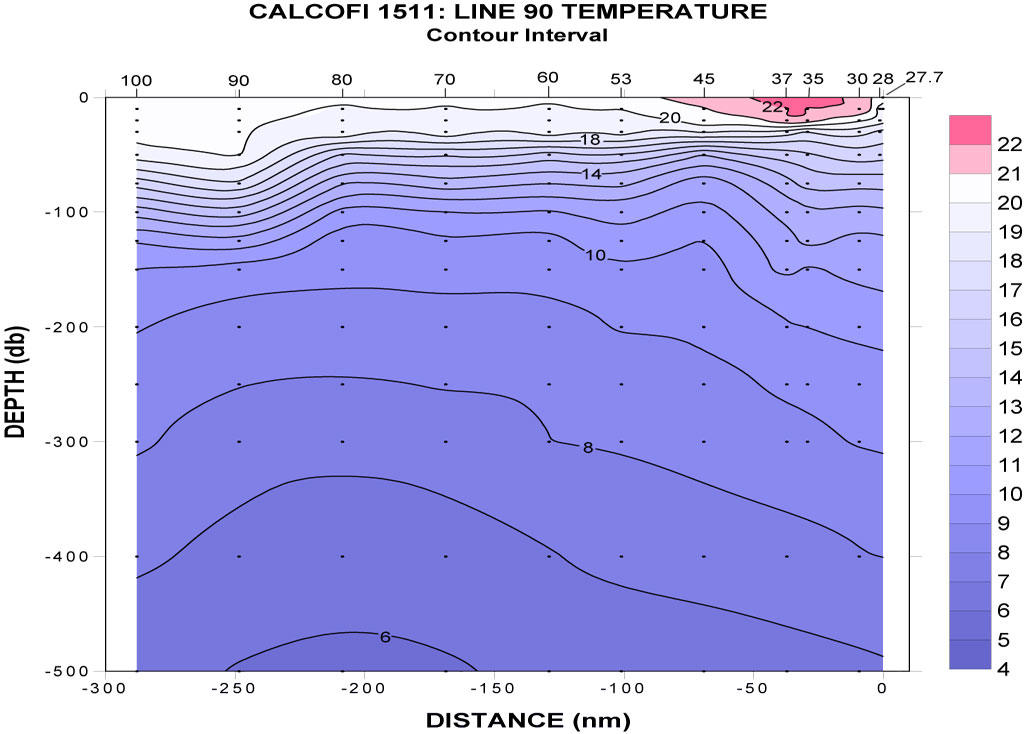
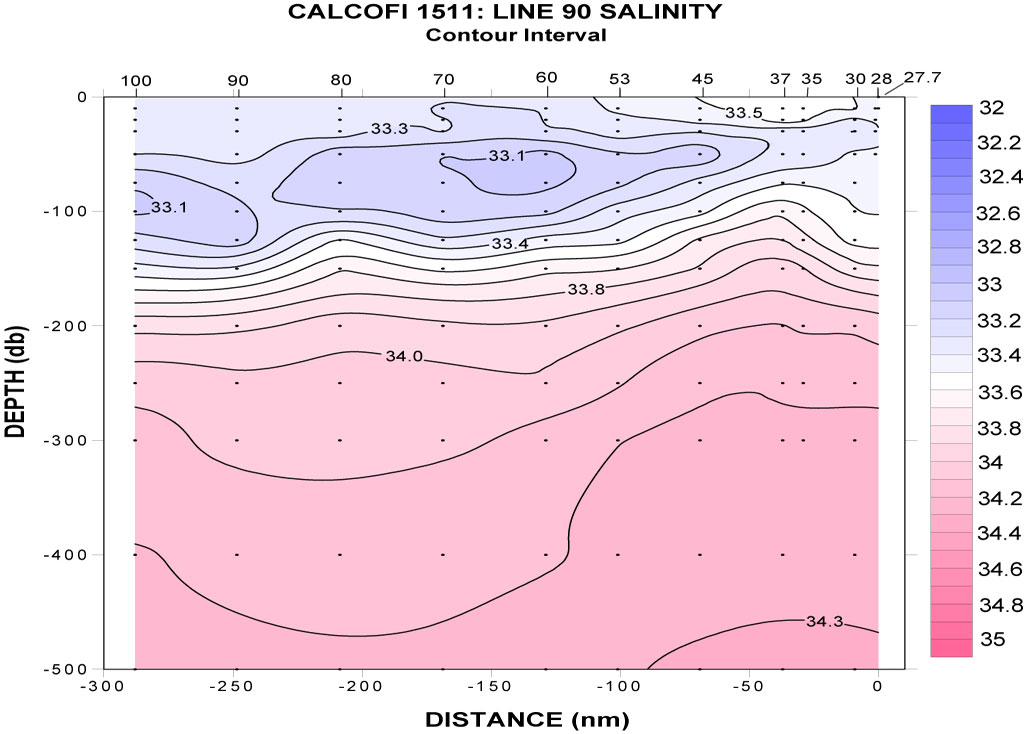
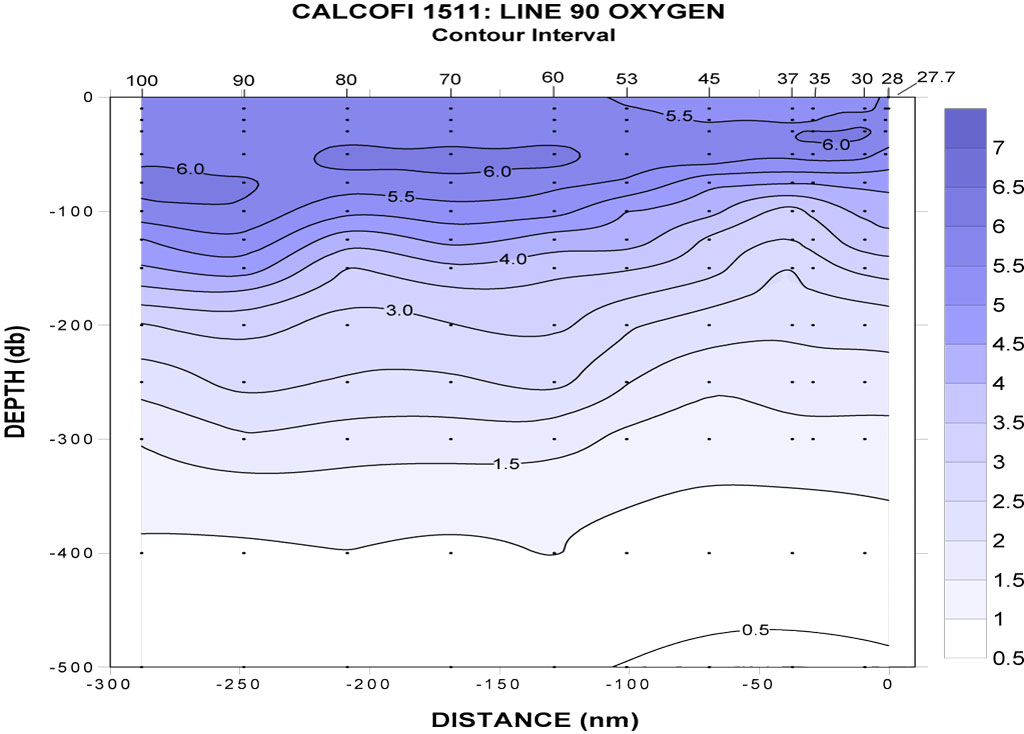
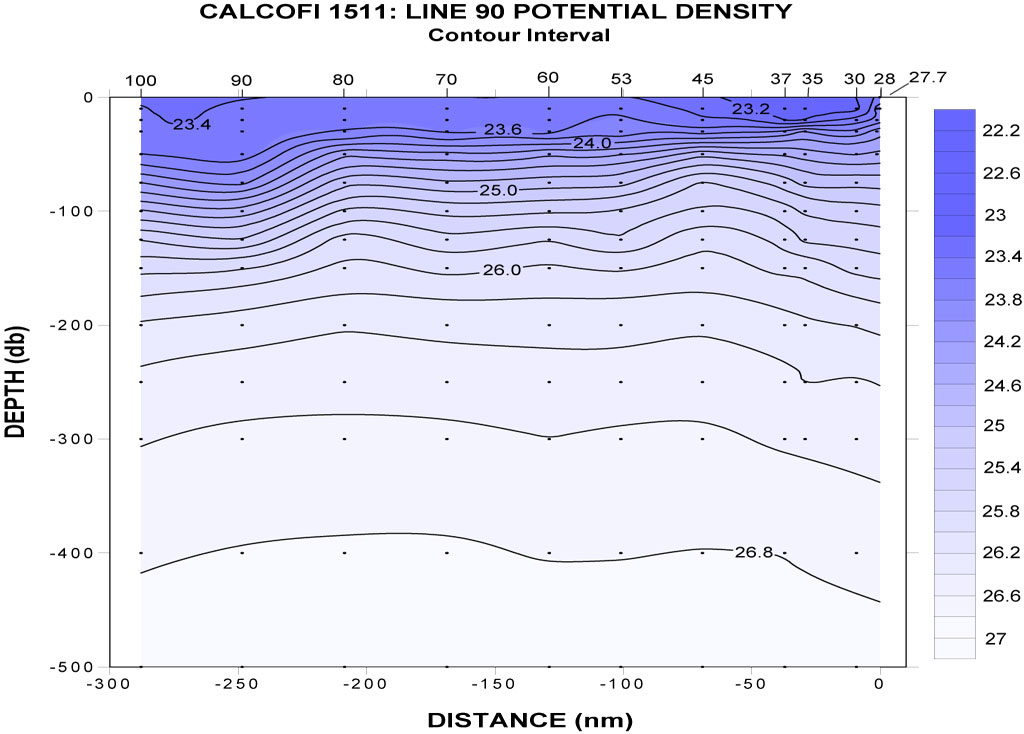
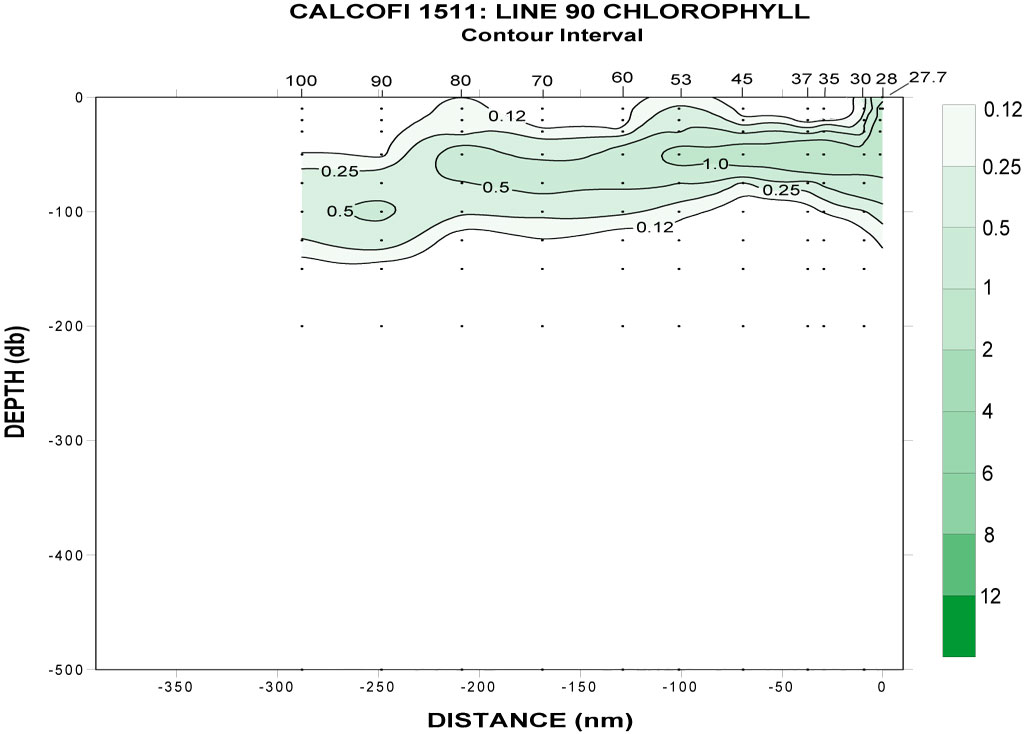
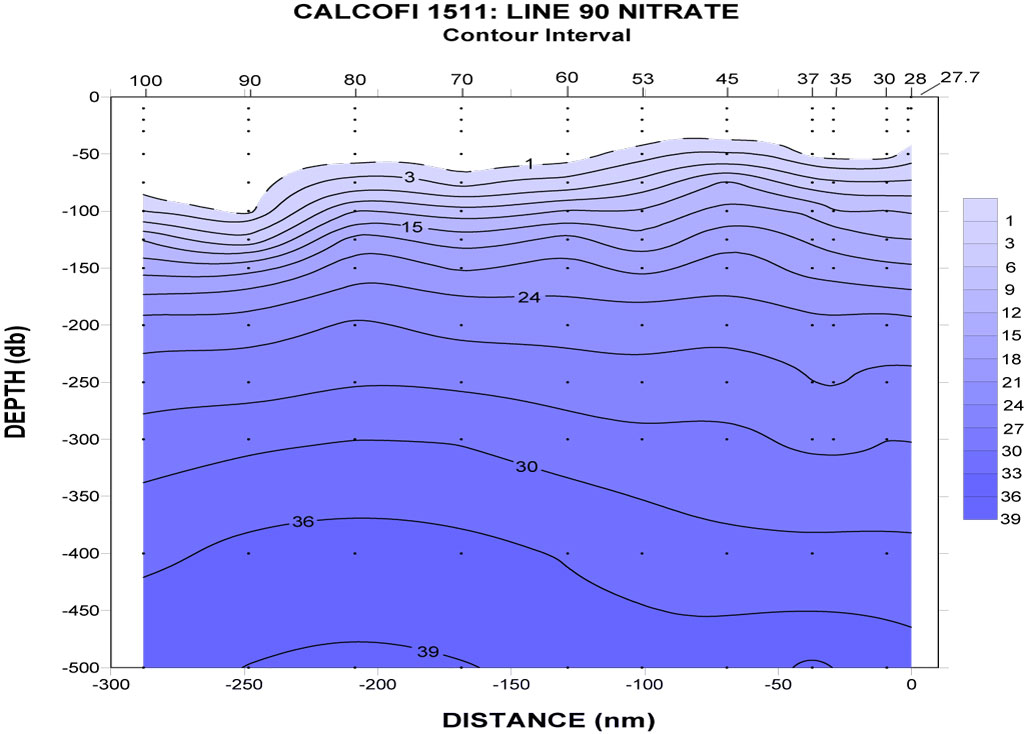
| Line 80 Vertical Plots (Click for larger image) | ||
 |
 |
 |
 |
 |
 |
 |
 |
 |
 |
 |
 |
| CTD Processing Summary CalCOFI 1511OC CTD Final Data | |||
|
Download 1511OC CTD raw cast files zipped There was a 03Dec update to the raw cast files. |
Download 1511OC FinalQC CTD + bottle data Note: near surface sensor data on casts 16 & 17 are bad. A faulty cable was replaced on cast 18. Also there were "pump off" issues at the start of casts 019-021. | ||
| General CTD Notes - data acquisition notes, logistics, processing - see below. Please note that these regressions are generated from CTD vs final bottle data after reprocessing with final bottle data. CTD temperatures and salinities do not usually change but oxygen, estimated chlorophyll-a, estimated nitrate may have changed significantly after point-checking. Questionable or mistrip bottle data are removed from these comparisons; questionable or bad CTD data may be visible on the CTD.csv plots but have been flagged with quality codes. For this cruise and future cruises, both primary & secondary sensor profiles vs bottle data have been generated and archived in the downloadable CTD+Bottle data files. These plots are under the "csv-plot\Primary" & "csv-plot\Secondary" subdirectories; regression plots are in the metadata directory. |
|||
| CTD sensor corrections derived by comparing CTD sensor data, 4sec average prior to bottle closure, to bottle samples | |||
| Dual T, S, & O2 | Primary Sensor | Secondary Sensor | |
| Salinity offset (bottle - CTD salinity; > 350m only; Seabird SBE4) | -0.00235 | 0.00061 | |
| Oxygen ml/L (dual Seabird SBE43) | y =1.0353x - 0.0064 R² = 0.9998 |
y = 1.0632x - 0.026 R² = 0.999 |
|
| Oxygen umol/Kg (dual Seabird SBE43) | y = 1.0369x-0.1339 R² = 0.9998 |
y = 1.0648x - 0.9879 R² = 0.999 |
|
| Single sensors | Linear | Polynomial | |
| Nitrate - ISUS 4sec ave voltage vs Bottle Nitrate (Satlantic MBARI-ISUS v2) | y = 28.632x-4.3398 R² = 0.9955 |
Please note: the ISUS was rebuilt prior to this cruise so early data may display lamp "burn-in". Sta-corrected estimated nitrate should be good. | |
| Fluorometer - linear & polynomial regressions |
y= 7.9809x-0.2728 R² = 0.7837 |
y = 26.251x2+1.9787x-0.0356 R² = 0.829 |
|
 |
 |
||
 |
 |
||
 |
 |
||
