CalCOFI Data Report Data Description:
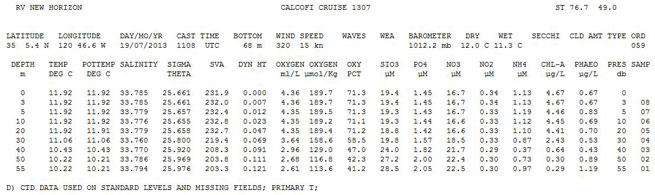
Line 1, Field 1: Research Vessel
Line 1, Field 2: Cruise Name
Line 1, Field 3: CalCOFI Line & Station (CalCOFI's standard line and station values)
Line 3, Field 1 - 2: Latitude and Longitude of station at beginning of CTD upcast
Line 3, Field 3 - 5: Cast Date & Time (UTC)
Line 3, Field 6: Corrected echo sounder bottom depth
Line 3, Field 7 - 8: Wind direction (360 degrees) & speed (kn) (WMO Codes 0877)
Line 3, Field 9 - 11: Wave direction (360 degrees), height (m), period (s) (WMO Codes 0885)
Line 3: Field 12: Weather code (WMO Code 4501 table)
Line 3, Field 13: Barometer (mb)
Line 3, Field 14 - 15: Dry and Wet bulb air temperatures (to derive relative humidity)
Line 3, Field 16: Secchi depth
Line 3, Field 17: Cloud Amount (WMO Code 2700)
Line 3, Field 18: Cloud Type (WMO Code 0500)
Data Records:
Depth (m)
Temperature (deg C)
Potential Temperature (deg C)
Salinity
Sigma Theta (density anomaly calculated with the potential temperature, salinity, and at 0 decibars pressure)
SVA - specific volume anomaly
Dyn Ht - dynamic height
Oxygen (ml/L)
Oxy Pct - Oxygen Saturation
SIO3 (uM/L) - Nutrient concentration Silicate
PO4 (uM/L) - Nutrient concentration Phosphate
NO3 (uM/L) - Nutrient concentration Nitrate
NO2 (uM/L) - Nutrient concentration Nitrite
NH4 (uM/L) - Nutrient concentration Ammonia
Chl-a (ug/L) - Chlorophyll-a concentration
Phaeo (ug/L) - Phaeopigment concentration
Pres (db) - Pressure in decibars
Samp - Cast+bottle number
Notes: ISL stands for interpolated standard level; CSL stands for CTD standard level data; D footnote denotes CTD data used instead of bottle data; U denotes uncertain values. Please refer to the data report bibliography for definitions/algorithms.
Comments: The specific volume anomaly is essentially the reciprocal of density, with the standard ocean (T=0, S=35) subtracted out, times ten to the fifth (therefore SVA=330 is really .00330). It is used to figure out how much higher or lower a column of water is relative to some common deep reference level (the dynamic height). SVA is integrated from a depth or pressure to some other depth or pressure to get the dynamic height between those depths. For example, if we integrate from 500 m to the surface and get 1.234 dynamic meters, that means that the ocean is about 1.234 meters taller than a standard ocean would be if it were all at 0 T and 35 S (if we divide by .98 (G) to get true length). The dynamic height is used to calculate the sea surface slope between stations to determine the relative (relative to the chosen reference level) geostrophic currents. A contoured field of dynamic height shows the location of eddys and direction of the currents, as well as the relative strength of the currents (the steeper the gradient, the faster the current).
The dynamic height can be negative if the water is colder than 0 degC, such as in the Norwegian Sea in winter, or if the salinity is much higher than 35, such as in the Mediterranean or Red Sea.
The sense of flow can be determined by imagining that you are standing on the high dynamic height side of the current, looking downhill the current is toward the right in the northern hemisphere. It would be in the opposite direction in the southern hemisphere. (Descriptions courtesy of Arnold Mantyla, Sep 10 2002)